background image

General Power Meter Functions

2

N1911A/1912A P-Series Power Meters User’s Guide

33

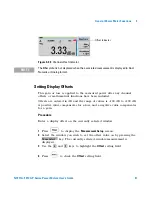
Setting the Resolution

The resolution of each of the power meter’s numeric type windows can be 
set to four different levels (1, 2, 3 or 4). 

These four levels represent:

• 1, 0.1, 0.01, 0.001 dB respectively if the measurement suffix is dBm or 

dB.

• 1, 2, 3 or 4 significant digits respectively if the measurement suffix is 

W or %.

The default value is 0.01 dB (3 digits).

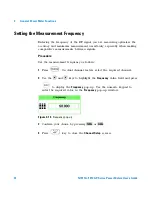
To set the resolution on the currently selected window:

1

Press 

. The current setting of the resolution is highlighted under 

the

 softkey. 

2

To change this setting, press 

 repeatedly until the required 

resolution setting is highlighted.

Resolution

Resolution

Содержание 1912A

Страница 1: ...Agilent Technologies Agilent N1911A 1912A P Series Power Meters User s Guide...

Страница 2: ...e material in this document that conflict with these terms the warranty terms in the sep arate agreement shall control Technology Licenses The hardware and or software described in this document are f...

Страница 3: ...for errors or for incidental or consequential damages in connection with the furnishing use or performance of this document or any information contained herein Should Agilent and the user have a separ...

Страница 4: ...om the Buyer s circuitry In addition Agilent does not warrant any damage that occurs as a result of the Buyer s circuit or any defects that result from Buyer supplied products To the extent allowed by...

Страница 5: ...as defined in FAR 2 101 a or as restricted computer software as defined in FAR 52 227 19 Jun 1987 or any equivalent agency regulation or contract clause whichever is applicable You have only those ri...

Страница 6: ...nologies recommends a two years calibration cycle for the N1911A and N1912A P Series power meter WARNING A WARNING notice denotes a hazard It calls attention to an operating procedure practice or the...

Страница 7: ...marked with this symbol when it is necessary for the user to refer to the instructions in the supplied docu mentation Alternating current AC This symbol indicates the operating switch for Stand by mo...

Страница 8: ...TECTIVE CONDUCTOR TERMINAL Frame or chasis TERMINAL Equipotentiality On Supply Off Supply Equipment protected throughout by DOUBLE INSULATION or REINFORCED INSULATION Caution risk of electric shock Ca...

Страница 9: ...N1911 1912A P Series Power Meters User s Guide ix Out position of bi stable push control...

Страница 10: ...hields are for use by service trained personnel only DO NOT service or adjust alone Under certain conditions dangerous voltages may exist even with the equipment switched off To avoid dangerous electr...

Страница 11: ...nce IEC 61010 1 2010 EN 61010 1 2010 3rd Edition Canada CAN CSA C22 2 No 61010 1 12 USA ANSI UL 61010 1 3rd Edition EMC compliance IEC 61326 1 2005 EN 61326 1 2006 CISPR11 2003 EN 55011 2007 Group 1 C...

Страница 12: ...of 1992 ICES NMB 001 indicates that this ISM device complies with the Canadian ICES 001 Cet appareil ISM est confomre a la norme NMB 001 du Canada This instrument complies with the WEEE Directive 200...

Страница 13: ...ity DoC for this instrument is available on the Agilent Web site You can search the DoC by its product model or description at the Web address below http regulations corporate agilent com DoC search h...

Страница 14: ...ow to use your E9300 E Series power sensor with your P Series power meter 6 Using E4410 E Series Power Sensors Chapter 6 describes how to use your E4410 E Series power sensor with your P Series power...

Страница 15: ...Information x Environmental Conditions xi Regulatory Information xi Regulatory Markings xii Declaration of Conformity DoC xiii In This Guide xiv 1 Introduction LXI Class C Compliant Power Meter 2 Rack...

Страница 16: ...surement Limits 86 Setting the Measurement Display 90 Scaling the Analog Display 97 Recorder Output 99 Saving and Recalling Power Meter States 104 Zeroing and Calibrating the P Series Sensor 107 Prese...

Страница 17: ...Meter Configuration 175 Measurement Accuracy 179 Frequency Specific Calibration Factors 180 Sensor Calibration Tables 184 8 Using N8480 Series Power Sensors Introduction 196 Power Meter Configuration...

Страница 18: ...Agilent Sales and Service Offices 251 11 Specifications and Characteristics Introduction 254 Power Meter Specifications 256 Measurement Characteristics 259 Rear Panel Inputs and Output Connections 26...

Страница 19: ...nfiguration settings from the Web interface 26 Figure 1 14 Password security dialog box 27 Figure 1 15 Changing the instrument LAN interface configuration 28 Figure 2 16 Frequency pop up 32 Figure 2 1...

Страница 20: ...gure 2 48 Trace Units pop up 64 Figure 2 49 Y scale maximum value pop up 64 Figure 2 50 Y Scale Division pop up 65 Figure 2 51 Trigger menu free run mode 66 Figure 2 52 Trigger Setting Menu 1 of 2 67...

Страница 21: ...up 106 Figure 2 87 Zeroing pop up 107 Figure 2 88 Calibration wait pop up 108 Figure 2 89 Please zero and calibrate window 110 Figure 2 90 Preset display options 111 Figure 3 92 P Series sensor defaul...

Страница 22: ...eraging settings 169 Figure 6 121 E Series E4410 sensor default channel setup 170 Figure 6 122 Frequency pop up 172 Figure 7 123 8480 Series auto averaging settings 175 Figure 7 124 8480 Series sensor...

Страница 23: ...e in full screen display 221 Figure 9 150 Trace Display Select control menu 222 Figure 9 151 CCDF trace display with Marker Trace menu 223 Figure 9 152 Scale Div pop up 225 Figure 9 153 Selection of C...

Страница 24: ...xxiv N19121A 1912A P Series Power Meters User s Guide THIS PAGE HAS BEEN INTENTIONALLY LEFT BLANK...

Страница 25: ...and frequency sweep measurement functions table 73 Table 2 7 Range of values for window limits 87 Table 2 8 Ranges of recorder output setting 101 Table 2 9 Preset compatibility matrix for E Series E93...

Страница 26: ...xxvi N19121A 1912A P Series Power Meters User s Guide THIS PAGE HAS BEEN INTENTIONALLY LEFT BLANK...

Страница 27: ...2 Rack Mounting 2 Power Meter and Sensor Capability 3 Conventions Used in this Guide 4 Front Panel Keys and Connections 5 The Display Layout 10 Window Symbols and Pop ups 18 Using the Instrument Web B...

Страница 28: ...N1911A 1912A can be mounted in a standard 19 inch rack Rack mount kits are available as listed below Support rails are also required for rack mounting These are normally supplied with the rack and ar...

Страница 29: ...s for the power meter are listed in Chapter 11 Specifications and Characteristics starting on page 253 Features P Series N1920 E Series E9320 E Series E9300 E Series E4410 8480 Series N8480 Series Ave...

Страница 30: ...uld press the unmarked key beside the displayed text Message This text represents a displayed message Parameter This is used to represent a parameter value or title Channel This User s Guide describes...

Страница 31: ...n it is operating via the remote interfaces when Local Lock Out is not enabled Press this key to select the upper or lower measurement window The selected window is highlighted by a blue line on the r...

Страница 32: ...ration menus Channel parameters such as averaging and offsets are configured from this menu Press this key to access the triggering menu Unless a P Series or an E Series E9320A Sensor is connected all...

Страница 33: ...are called softkeys and are referred to by the text on the display next to them For example during a Preset you are given an option to confirm the command Press to continue that is press the softkey...

Страница 34: ...ng values from a pop up list they can also be used for stepping two values X Scale and Y Scale They are also used to enter text for example table names Press this key to select a highlighted field to...

Страница 35: ...calibrating an 8480 E Series or N8480 Series power sensor and meter system If the meter is configured with Option 003 the connector is fitted to the rear panel The Green LED beside the connector is li...

Страница 36: ...AN operation or LCL local front panel operation The message fields indicate ERR for any error conditions that occur or informing you to Please Zero the power sensor 2 The blue highlight on the right h...

Страница 37: ...e are two pages in the menu and the first page is currently displayed Pressing the softkey displays the next page indicated by 2 of 2 Press the softkey to display the previous menu page 8 The availabl...

Страница 38: ...ingle enlarged window or a full screen display by pressing The display style is applied to the currently selected window or measurement line 11 The upper window is configured to show a single numeric...

Страница 39: ...its this field is empty If the measurement result is less than the minimum limit set Undr Lmt is displayed If the measurement result is more than the maximum limit set Over Lmt is displayed 18 This fi...

Страница 40: ...ace channel and scaling are displayed The lower window is the selected window 23 The indicates the point on the trace where trigger event occurs NOTE The following trace displays are only available wh...

Страница 41: ...he green border shows the time Time and the instantaneous power level Pow of the active marker at the configured point A negative time value indicates a measurement before the trigger point 27 This ta...

Страница 42: ...When the two points coincide only the trigger is shown In the example shown in Figure 1 6 the appears ahead of the as a trigger delay of 5 00 s has been configured placing the measurement trigger bef...

Страница 43: ...e X and Y trace setup fields Using the or keys you can highlight the item and change its value 34 The current settings of the X and Y scale are displayed in this reporting line 35 This table shows 8 a...

Страница 44: ...e There are three different colors used to signify the pop up status Green used to allow data entry Orange used to display information Red used to display an error Warning Symbol Pop up The warning sy...

Страница 45: ...mbol appears in a pop up window It may appear for example during a calibration Confirm Symbol Pop up This type of pop up window is displayed when you are required to press Confirm to verify your previ...

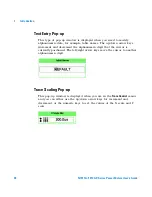
Страница 46: ...arrow keys increment and decrement the alphanumeric digit that the cursor is currently positioned The left right arrow keys move the cursor to another alphanumeric digit Trace Scaling Pop up This pop...

Страница 47: ...2A P Series Power Meters User s Guide 21 List Pop up This pop up window is displayed when you are required to select an entry from a list Use the up down arrow keys to highlight your choice Press sele...

Страница 48: ...eb browser The instrument s Web browser can be opened from Agilent Connection Expert as shown in Figure 1 8 Figure 1 8 Opening the instrument Web interface NOTE Alternatively the instrument s Web base...

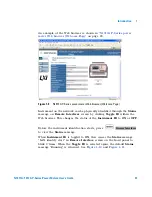
Страница 49: ...tatus message on Remote Interfaces screen by clicking Toggle ID within the Web browser This changes the status of the Instrument ID to ON or OFF Before the instrument identification starts press to vi...

Страница 50: ...ed When power meter is configured to LAN the Lan Status on screen will show the LAN error condition and status of the LAN configuration connection There are six types of Lan Status messages that may o...

Страница 51: ...ile network is running Lan Fault Status Initialization failed IP conflict occurs or IP address failed to be obtained using selected LAN configuration or No LAN configuration is selected Lan Fault Stat...

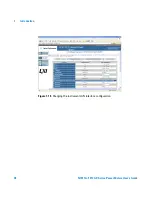
Страница 52: ...trument s LAN configuration can be viewed and modified using the Web browser On the Welcome Page click View and Modify Configuration This opens the configuration window shown in Figure 1 13 Figure 1 1...

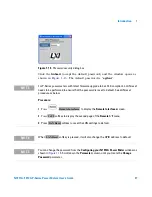
Страница 53: ...at the password is reset to default See LAN reset procedure as below Procedure 1 Press to display the Remote Interfaces screen 2 Press softkey to display the second page of the Remote I F menu 3 Press...

Страница 54: ...1 Introduction 28 N1911A 1912A P Series Power Meters User s Guide Figure 1 15 Changing the instrument LAN interface configuration...

Страница 55: ...Video Averaging 52 Setting the Video Bandwidth 54 Setting Measurement Channel Gates 57 Setting up the Channel Trace 62 Setting the Trigger 66 Setting External Trigger for Normal and Average Power Mea...

Страница 56: ...icable to each measurement mode Press Select the unit of measurement from and Softkeys which cannot be selected in your particular mode of operation are grayed out Table 2 2 Measurement units Single c...

Страница 57: ...urement for power In some cases due to the availability of wide power range the following menu is displayed Pressing or increases or decreases the multiplier shown in front of Pressing after the corre...

Страница 58: ...ng comparative measurements between signals Procedure Set the measurement frequency as follows 1 Press On dual channel meters select the required channel 2 Use the and keys to highlight the Frequency...

Страница 59: ...ent 1 0 1 0 01 0 001 dB respectively if the measurement suffix is dBm or dB 1 2 3 or 4 significant digits respectively if the measurement suffix is W or The default value is 0 01 dB 3 digits To set th...

Страница 60: ...ure 2 17 shows a Measurement Setup display and the relative measurement items labeled 2 Select the window you wish to set a reference value on by pressing the key The currently selected window measure...

Страница 61: ...Rel check field 8 The relative value displayed under Result field will change as the measured signal varies NOTE If you return the power meter to display the numeric display a Rel symbol will be disp...

Страница 62: ...display the Measurement Configuration screen Press the softkey to select the desired channel for a dual channel power meter N1912A Figure 2 19 Measurement configuration screen 1 of 2 Meas Config Chan...

Страница 63: ...Trace Ref Lvl 1 field 2 Press to display the Trace Ref Lvl 1 pop up and use the numeric keypad to enter the intended value in the Trace Ref Lvl 1 pop up window Figure 2 21 Trace Ref Lvl 1 pop up 3 Co...

Страница 64: ...plete the entry by pressing the softkey 7 Use the and keys to highlight the Pulse Duration Ref Lvl field 8 Press to display the Pulse Duration Ref Lvl pop up and use the numeric keypad to enter the in...

Страница 65: ...each channel individually An overall offset can be applied if required using the Display Offset Setting Channel Offsets This gain or loss is applied to the measured power before any mathematical func...

Страница 66: ...ht the Offset setting field 4 Press to check the Offset setting field Figure 2 25 Typical channel offset display 5 Press to highlight the Offset value field and press to display the Offset pop up Use...

Страница 67: ...ompensates for a loss and a negative value compensates for a gain Procedure Enter a display offset on the currently selected window 1 Press to display the Measurement Setup screen 2 Select the window...

Страница 68: ...ng Frequency Dependent Offsets Frequency dependent offset tables provide a quick and convenient method of compensating for frequency related changes in the response of your test system Note that when...

Страница 69: ...alibration table if selected 3 Specify the frequency of the signal you want to measure The calibration factor offset is automatically set by the power meter from the sensor calibration table if select...

Страница 70: ...able Figure 2 28 Frequency dependent offset tables display 2 Use the and keys to highlight one of the 10 table titles and press to highlight 3 Press to complete the selection of the offset table 4 Pre...

Страница 71: ...pty of any data when the power meter is shipped from the factory You cannot delete any of the 10 existing frequency dependent offset tables or create any additional tables However you can enter values...

Страница 72: ...e you want to edit 2 Rename the table 3 Enter the frequency and offset pairs 4 Save the table Procedure First select the table you want to edit as follows 1 Press to display the Offset Tbls screen 2 C...

Страница 73: ...e title pop up Pressing adds a new character to the right of the selected character Pressing removes the selected character 4 Press to complete the entry Change Insert Char Delete Char Enter NOTE The...

Страница 74: ...to edit Use the numeric keypad to enter the required value in the Offset pop up window Complete the entry by pressing the key 3 Continue adding editing values until you have entered all the data you r...

Страница 75: ...auto measurement average mode is enabled the power meter automatically sets the number of readings averaged together to satisfy the filtering requirements for most power measurements The number of rea...

Страница 76: ...e measurement suffix is W or Procedure Set measurement averaging as follows 1 Press On dual channel meters select the required channel The current setting is shown in the Meas Avg field AUTO MAN or OF...

Страница 77: ...itialize upon detection of a step increase or decrease in the measured power Step detection can be set in both manual and automatic measurement average modes Procedure Set step detection as follows 1...

Страница 78: ...uce apparent noise The measurement requires a continuously repeating signal Increasing the value of this filter reduces noise but increases the time required to make the measurement Procedure Set the...

Страница 79: ...Functions 2 N1911A 1912A P Series Power Meters User s Guide 53 Figure 2 34 Video Avg Count pop up 6 Use the and keys to highlight the required Video Avg Count value and press 7 Press key to close the...

Страница 80: ...duce the processing speed for long acquisition times Table 2 4 P Series Sensor Video Bandwidth Setting The Low Medium and High pass band shapes achieved by the video bandwidth settings provide flat fi...

Страница 81: ...imizing overshoot and removing any ringing effects caused by the sharp cut off filters used in the Low Med and High settings Figure 2 35 shows the filter shapes associated with the P Series wideband p...

Страница 82: ...Functions 56 N1911A 1912A P Series Power Meters User s Guide Figure 2 36 Video bandwidth pop up 4 Use the and keys to highlight the required Video Bandwidth setting and press 5 Press key to close the...

Страница 83: ...be set up for each channel Figure 2 37 shows an example of 4 gates setup to perform the following measurements simultaneously Average power level of the pulse Gate 1 average measurement Average off p...

Страница 84: ...placement NOTE This procedure uses the Gates Setup under the Channel Setup menu Alternatively you can use a more visual method when in the Graphical Trace Mode Gate Control Menu to set the channel s G...

Страница 85: ...te Length you want to configure using the and keys Figure 2 40 Time Gating Length pop up 5 Complete the entry by pressing the required second millisecond or microsecond or nanosecond or softkey 6 Repe...

Страница 86: ...Press softkey The Marker 1 Ref Percentage pop up is displayed Figure 2 42 Marker 1 Ref Percentage pop up 3 Use the numeric keys to complete the entry and press softkey 4 Press softkey The Marker 2 Re...

Страница 87: ...tage pop up 5 Use the numeric keys to complete the entry and press softkey Figure 2 44 The placement of gates markers in Auto Gating mode Pulse Duration PD Ref 1 x PD Ref 2 x PD NOTE Enabling the soft...

Страница 88: ...This feature is only available when a P Series or an E Series E9320 power sensor is connected NOTE The Trace Setup is the only location where you can change the Y axis units from dBm to Watts NOTE Thi...

Страница 89: ...the required second millisecond microsecond or nanosecond or softkey 5 Use the and keys to highlight the X Scale field 6 Press to display the X Scale Division pop up a Use the numeric keypad to enter...

Страница 90: ...s to complete the entry 11 Use the and keys to highlight the Y Max field 12 Press to display the Trace Maximum pop up and use the numeric keypad to enter the required value in the Trace Maximum pop up...

Страница 91: ...nd display the measurements results Auto Scale Auto Scale automatically configures the window s X axis and Y axis to best display the input trace 1 Press softkey under Gate Ctrl menu 2 softkey is pres...

Страница 92: ...triggered Press The Trigger menu is displayed The trigger status is displayed below the label in the Trigger menu Figure 2 51 shows the power meter display in Free Run mode In this mode the meter is...

Страница 93: ...ws page one and Figure 2 55 shows page two Figure 2 52 Trigger Setting Menu 1 of 2 To help you quickly check the triggering setup the current settings for all the trigger parameters are shown with the...

Страница 94: ...setting press and use the numeric keypad to enter the required value in the Trigger Level pop up window to enter the new value Figure 2 53 Trigger Level pop up Complete the entry by pressing Delay The...

Страница 95: ...e required second millisecond microsecond or nanosecond or softkey Press to display the second menu page Figure 2 55 Trigger setting menu 2 of 2 s ms us ns NOTE The trigger delay time can also be ente...

Страница 96: ...ic keypad to enter the required value in the Trigger Holdoff pop up window to enter the new value Figure 2 56 Trigger Holdoff pop up Complete the entry by pressing or Hysteresis is only available when...

Страница 97: ...equal to the trigger level plus the configured hysteresis value To change the setting press and use the numeric keypad to enter the required value in the Trigger Hysteresis pop up window to enter the...

Страница 98: ...own in Figure 2 58 illustrates the triggering connection required to synchronize power meter measurement to the power source settings Table 2 5 below shows the power and frequency sweep mode compatibi...

Страница 99: ...est Procedures 1 Connect sensor to a power source 2 Connect power meter TRIG OUT to power source TRIG IN using a BNC cable The same connection is applied for power source TRIG OUT to power meter TRIG...

Страница 100: ...een power meter and power source 3 Press The Channel Setup screen displays as below Figure 2 59 Channel Setup display TRIG IN TRIG IN TRIG OUT TRIG OUT Power Meter Power Source Power Sensor optional c...

Страница 101: ...eries N1920 sensor is connected the default sensor mode is Normal User can use this Normal mode to perform power or frequency sweep or change the mode to AVG only to perform power or frequency sweep R...

Страница 102: ...1 shows page 1 and Figure 2 62 shows page 2 Figure 2 61 Trigger setting menu 1 of 2 Figure 2 62 Trigger setting menu 2 of 2 8 Press and will be automatically enabled 9 Press select to allow a TTL leve...

Страница 103: ...wer source accordingly 16 Set the power source trigger input and trigger output then start sweeping NOTE In both power sweep and frequency sweep mode the meter TRIG OUT to power source TRIG IN connect...

Страница 104: ...power sweep measurement Normal mode This feature is applicable for E9320 and N1920 Series power sensor when connected Below are examples of SCPI commands when used in normal mode Send the SCPI command...

Страница 105: ...E4410 E Series E9300 E Series E9320 or P Series N1920 sensor when connected Below are examples of SCPI commands when used in average mode Send the SCPI commands below to meter using remote interface S...

Страница 106: ...er test Procedures 1 Connect sensor to a power source 2 Connect power meter TRIG OUT to power source TRIG IN using a BNC cable The same connection is applied for power source TRIG OUT to power meter T...

Страница 107: ...Table 2 6 on the differences in measurement functions supported under these two modes To change the sensor mode from the default Normal mode to AVG only mode follow the instructions below Press Use th...

Страница 108: ...er when all pending device operations are completed 13 Set the meter to continuous trigger cycles by sending INITiate CONTinuous ON command to meter 14 Configure and set the required frequency sweep r...

Страница 109: ...ower sensor when connected Below are examples of SCPI commands when used in normal mode Send the SCPI commands below to meter using remote interface SENS DET FUNC NORM TRIG SOUR EXT SENS FREQ START 50...

Страница 110: ...Series E9320 or P Series N1920 sensor when connected Below are examples of SCPI commands when used in average mode Send the SCPI commands below to meter using remote interface SENS DET FUNC AVER TRIG...

Страница 111: ...by using equation below Step fstop fstart Interval Interval where Step Number of frequency step fstart Frequency sweep s start point fstop Frequency sweep s stop point Interval Frequency step size Exa...

Страница 112: ...r ratio or difference measurement Figure 2 63 Limits checking applications In this application a swept frequency signal is applied to the input of the Device Under Test The power meter measures the ou...

Страница 113: ...ed measurement line see Table 2 7 Table 2 7 Range of values for window limits Procedure Set the limits as follows 1 Press to display the Measurement Setup menus 2 Use the and keys to highlight the Lim...

Страница 114: ...se the numeric keys to enter the required value and press 7 Use the key to highlight the Maximum Limits value field 8 Press to display the Maximum Limit pop up 9 Use the numeric keys to enter the requ...

Страница 115: ...imit failures are displayed in the appropriate field in the measurement window on the power meter s display as shown in Figure 2 66 Figure 2 66 Limit failures This measurement has failed as the result...

Страница 116: ...trol of the displayed information The power meter cannot display all 16 or 32 measurements simultaneously Average peak peak to average ratio and minimum measurements are made within each gate period g...

Страница 117: ...le Mode In Combined Mode Feed 1 Feed 2 or Feed 1 Feed 2 can be displayed Numeric Format Configure a measurement displayed in or format as follows Peak Average Pk to Avg Gate 1 Peak Average Pk to Avg F...

Страница 118: ...nction Measurement Figure 2 69 shows Gate 1 with an average measurement assigned in the upper measurement line of the lower window For single channel power meter N1911A the Channel field will be disab...

Страница 119: ...he and to highlight Single Figure 2 70 Function pop up 3 Press to complete the entry 4 Use the to highlight the measurement type field 5 Press to display the Feed Measurement pop up and use the and in...

Страница 120: ...pop up and use the numeric keypad to enter the required value in the Gate Number pop up window Figure 2 72 Gating Number pop up 9 Press to complete the entry 10 Repeat this process until you have setu...

Страница 121: ...r N1911A the Channel field will be disabled as shown in Figure 2 73 Figure 2 73 Measurement Setup showing combined configuration 1 Use the to highlight the Combination function field 2 Press to displa...

Страница 122: ...ry 7 Use the to highlight the Gate field 8 Press to display the Gate Number pop up see Figure 2 72 and use the numeric keypad to enter the required value in the Gate Number pop up window 9 Press to co...

Страница 123: ...oftkey labels 2 Press to display the Meter Maximum pop up Figure 2 75 Maximum limit pop up 3 Use the numeric keys to enter the required value and press 4 Press to display the Meter Minimum pop up Figu...

Страница 124: ...he range of the displayed menu an additional menu is available When the pop up is displayed you can press 1 of 2 to access the increment decrement multiplier menu Figure 2 77 Increment and decrement m...

Страница 125: ...used to Record swept measurements Level an output from a source using external leveling Monitor the output power To access the Recorder menu press and enable Rec o p This allows you to switch the Rec...

Страница 126: ...Press 6 Use the key to highlight the Recorder Minimum value field 7 Press to display the Recorder Minimum pop up Figure 2 78 Recorder Minimum pop up 8 Use the numeric keys to enter the power level yo...

Страница 127: ...put setting dBm NOTE The recorder output can be disabled and re enabled by checking the Rec o p setting field NOTE The highest power you are going to measure is used to determine the value which you s...

Страница 128: ...isplay the required units Press the units softkey to complete the entry N1911A N1912A Option H02 Press these keys to select the units required Increment Multiplier Decrement Multiplier xW NOTE N1911A...

Страница 129: ...generator and Infiniium 54832D oscilloscope will be used 1 Connect the power sensor input to the RF input of the signal generator 2 Connect the video output of the power meter Option H02 to the channe...

Страница 130: ...ve a measurement setup 1 Press to display the Save Recall screen as shown in Figure 2 83 Figure 2 83 Save Recall screen 2 Using the and keys select an available name from the displayed list To change...

Страница 131: ...ady done so press 2 Use the and keys to select the required register and press The selected name is displayed in a pop up window Modify this as required Figure 2 85 File name pop up 3 Use and keys to...

Страница 132: ...ower Meters User s Guide Recalling a Measurement Setup 1 Press 2 Use the and keys to select the required register and press The key is disabled grayed out when an unused register is selected Figure 2...

Страница 133: ...The power meter can be set to automatically zero on the fly while you are using it Alternatively you can perform a zero at your preference During zeroing a wait symbol is displayed Figure 2 87 Zeroing...

Страница 134: ...nce The power meter can be set to automatically calibrate on the fly while you are using it Alternatively you can perform the calibration manually The reference calibration factor is automatically set...

Страница 135: ...n 1 Press and the channel softkey to start the calibration routine The Calibrating pop up is then displayed Tip You can reduce the steps required to carry out the manual zero and calibration procedure...

Страница 136: ...and Cal is displayed Figure 2 89 Please zero and calibrate window When you zero the sensor the message changes to Please Cal If you calibrate the sensor before zeroing it the message changes to Pleas...

Страница 137: ...reset conditions Press the to display the preset options as shown in Figure 2 90 Figure 2 90 Preset display options The remote addresses the data stored in the sensor calibration tables the calibratio...

Страница 138: ...326A E9327A W CDMA E9323A E9327A cdma2000 E9323A E9327A iDEN E9321A E9322A E9323A E9325A E9326A E9327A Radar E9321A E9322A E9323A E9325A E9326A E9327A MCPA E9321A E9322A E9323A E9325A E9326A E9327A 80...

Страница 139: ...his is the default setting and for sensor cable length less than or equal to 10 m 32 ft Long This setting is for sensor cable length more than 10 m 32 ft The maximum supported sensor cable length is 3...

Страница 140: ...2 General Power Meter Functions 114 N1911A 1912A P Series Power Meters User s Guide THIS PAGE HAS BEEN INTENTIONALLY LEFT BLANK...

Страница 141: ...a Power Measurement 117 Setting the Trace Display 118 This chapter describes how to use your P Series power sensors N1921A N1922A N1923A 1 N1924A 1 with your P Series power meters 1 The N1923 24A powe...

Страница 142: ...wideband power sensor continuously sample the RF signal at a 100 mega samples per second Similarly the dual channel meter samples both channels at the same rate The instantaneous power of an RF signa...

Страница 143: ...splay s Gate Control and Trace Control menus to configure your initial set up as it is a more interactive process and may require less iterations between channel triggering gate and display functions...

Страница 144: ...el Frequency 3 Set the Trigger to Continuous 4 Set the Display to Trace 5 Expand window and use the Gate control and Trace control menus to set the gate markers trigger delay and scale 6 When you are...

Страница 145: ...ct the sensor to the power source Step 2 Setting the Channel Frequency Press The Channel Setup screen is displayed If using an N1912A select the channel you want to configure Use the and keys to highl...

Страница 146: ...tus is displayed below the label in the Trigger menu Press the softkey and select to configure continuous triggering When you have completed the procedure you may return to the Trigger menu later to a...

Страница 147: ...re 3 94 is an example of this display This display type also provides a visual method of setting up the gate trigger delay and trace controls Use the key to configure the display from two rectangular...

Страница 148: ...is available Setting the gate features are described in greater detail in Setting Measurement Channel Gates on page 57 However the following sections are to give you an overview of the control and the...

Страница 149: ...onfigured points The table highlighted with the green border represents the active marker also highlighted in green A negative time value indicates a measurement before the trigger point See Figure 3...

Страница 150: ...r delay by pressing and entering a numeric value in the pop up window Pressing highlights to display the trace markers again Trace Control Press to display the Trace Control menu Setting the trace fea...

Страница 151: ...ccurrence time to negative occurrence pulse width pulse period pulse repetitive interval pulse repetitive frequency and duty cycle The current settings of the X and Y scale are displayed on the report...

Страница 152: ...on on the display You can press or to display the results as set in Single Enlarged Window mode The current settings of the X and Y scale are displayed on the reporting line above the results You need...

Страница 153: ...A select the channel you want to configure Figure 3 99 P Series power sensor default channel setup Use the and keys to highlight the setting field and press to configure the setting For further detail...

Страница 154: ...g these refer to the appropriate section Offset Setting Channel Offsets on page 39 FDO Table Setting Frequency Dependent Offsets on page 42 Trigger Setup Press The Trigger menu is displayed The trigge...

Страница 155: ...ther detail on these settings refer the appropriate section Feed1 2 Setting the Measurement Display on page 90 Offset Setting Display Offsets on page 41 Limits Setting Measurement Limits on page 86 Di...

Страница 156: ...3 Using P Series Power Sensor 130 N1911A 1912A P Series Power Meters User s Guide THIS PAGE HAS BEEN INTENTIONALLY LEFT BLANK...

Страница 157: ...4 Using E9320 E Series Power Sensors Introduction 132 Power Meter Configuration 134 Configuring a Peak Power Measurement 135 Measurement Accuracy 136 Setting the Trace Display 138 This chapter describ...

Страница 158: ...ers and E9320 E Series power sensors continuously sample the RF signal at a 20 Msamples s rate A trigger can be taken from a rising or falling edge of an RF signal pulse or controlled externally via G...

Страница 159: ...E9327A power sensors Figure 4 101 Bandwidth Filter Shapes NOTE Maximum dynamic range is related to the maximum sensor bandwidth Please refer to the documentation supplied with your E Series E9320 powe...

Страница 160: ...ected The sensor calibration data characterizing the sensor output versus input power frequency and temperature is automatically read by the power meter Default Channel Setup When an E Series E9320 po...

Страница 161: ...ndwidth of any modulating signal the expected maximum and minimum power levels timing information for any pulsed signals You can configure the required measurements using numeric data entry from the k...

Страница 162: ...calibration factors enables you to achieve improved measurement accuracy This section describes making continuous wave measurements using the E9320 E Series power sensors Making a measurement require...

Страница 163: ...Use the numeric keypad to enter the required value in the Frequency pop up window Figure 4 103Frequency pop up 7 Confirm your choice by pressing or 8 Press key to close the Channel Setup screen Now m...

Страница 164: ...annel Frequency 3 Set the Trigger to Continuous 4 Set the Display to Trace 5 Expand window and use the Gate control and Trace control menus to set the gate markers trigger delay and scale 6 When you a...

Страница 165: ...eys to highlight the frequency field Press to configure the setting See Setting the Measurement Frequency on page 32 for further information When you have completed the procedure you can return to thi...

Страница 166: ...gger is selected Step 4 Setting the Display to Trace Using trace display provides a visual representation of the signal of interest Press to display the Trace the highlighted window Figure 4 105Trace...

Страница 167: ...play type also provides a visual method of setting up the gate trigger delay and trace controls Use the key to configure the display from two rectangular windows to a single enlarged window or a full...

Страница 168: ...enu is available Setting the gate features are described in greater detail in Setting Measurement Channel Gates on page 57 However the following sections are to give you an overview of the control and...

Страница 169: ...ured points The table highlighted with the green border represents the active marker also highlighted in green A negative time value indicates a measurement before the trigger point See Figure 4 107 F...

Страница 170: ...lay by pressing and entering a numeric value in the pop up window Pressing highlights to display the trace markers again Trace Control Press to display the Trace Control menu Setting the trace feature...

Страница 171: ...red pulse after the trigger The 8 measurements are rise time fall time time to positive occurrence time to negative occurrence pulse width pulse period pulse repetitive interval pulse repetitive frequ...

Страница 172: ...splay the trace in a full screen window display This provides a better resolution on the display You can press or to display the results as set in Single Enlarged Window mode The current settings of t...

Страница 173: ...he channel you want to configure Figure 4 111E Series E9320 power sensor dafault channel setup Use the and keys to highlight the setting field and press to configure the setting For further detail on...

Страница 174: ...etting Channel Offsets on page 39 FDO Table Setting Frequency Dependent Offsets on page 42 Trigger Setup Press The Trigger menu is displayed The trigger status is displayed below the label in the Trig...

Страница 175: ...tings refer the appropriate section Feed1 2 Setting the Measurement Display on page 90 Offset Setting Display Offsets on page 41 Limits Setting Measurement Limits on page 86 Display Press The Display...

Страница 176: ...4 Using E9320 E Series Power Sensors 150 N1911A 1912A P Series Power Meters User s Guide THIS PAGE HAS BEEN INTENTIONALLY LEFT BLANK...

Страница 177: ...on 152 Power Meter Configuration 153 Measurement Accuracy 155 Measuring Spread Spectrum and Multitone Signals 157 Measuring TDMA Signals 160 Electromagnetic Compatibility EMC Measurements 162 Measurem...

Страница 178: ...eld the average of complex modulation formats across a wide dynamic range irrespective of signal bandwidth Further refinements are included to improve power handling allowing accurate measurement of h...

Страница 179: ...ngs 4 dBm 10 dBm Sensor Power Minimum Sensor Dynamic Range 10 dBm 2 dBm 1 2 3 4 1 1 1 4 Resolution Setting Number of Averages 1 1 4 16 1 1 8 32 1 4 16 128 1 16 64 128 Maximum 40 dBm 50 dBm 20 dBm 30 d...

Страница 180: ...eters User s Guide Default Channel Setup When an E Series E9300 power sensor is connected the following Channel Setup is automatically configured Carrying out a Preset returns the power meter to this...

Страница 181: ...sensors Making a measurement requires the following steps 1 Zero and calibrate the power meter sensor combination 2 Set the frequency for the signal you want to measure 3 Make the measurement Procedu...

Страница 182: ...splay the Frequency pop up Use the numeric keypad to enter the required value in the Frequency pop up window Figure 5 115Frequency pop up 7 Confirm your choice by pressing or 8 Press key to close the...

Страница 183: ...ion signal is shown in Figure 5 116 Figure 5 116Spread spectrum signal The diode pair attenuator diode pair architecture of the E9300 E Series power sensors is ideally suited to the average power meas...

Страница 184: ...fference between the two values stops changing The CW sensor in Figure 5 117 uses correction factors to correct for power levels beyond its square law operating region Figure 5 117Wideband CDMA error...

Страница 185: ...equency response as shown in Figure 5 119 This is ideal for amplifier intermodulation distortion measurements where the components of the two tone or multitone test signal can be separated by hundreds...

Страница 186: ...llows large physical distances between power sensor and power meter Agilent 11730 Series cables available up to 61 metres Additional averaging helps reduce noise susceptibility Achieving Stable Result...

Страница 187: ...on frequency PRF close to a multiple or sub multiple of the 440 Hz chopper amplifier signal generate a beat note at a frequency between the PRF and 440 Hz Control over the filter settings is again req...

Страница 188: ...l Perturbations Radioelectriques requirements and electromagnetic interference EMI test applications such as the radiated immunity test IEC61000 4 3 DC coupling of the E9304A input allows excellent lo...

Страница 189: ...settings LOWER and UPPER The LOWER range uses the more sensitive path and the UPPER range uses the attenuated path in the E9300 E Series power sensors The default is AUTO In AUTO the range crossover...

Страница 190: ...ging is a good starting point it is not ideal for all measurements Signal conditions such as crest factor or duty cycle may cause the power meter to select a range which is not the optimum configurati...

Страница 191: ...er meter selects the low power path in the E Series E9300 power sensor With auto averaging also configured minimal filtering is applied Values of 1 to 4 for average power levels above 20 dBm are used...

Страница 192: ...5 Using E9300 E Series Power Sensors 166 N1911A 1912A P Series Power Meters User s Guide THIS PAGE HAS BEEN INTENTIONALLY LEFT BLANK...

Страница 193: ...User s Guide Agilent Technologies 6 Using E4410 E Series Power Sensors Introduction 168 Power Meter Configuration 169 Measurement Accuracy 171 This chapter describes how to use your E4410 E Series po...

Страница 194: ...are high speed power sensors and do not incorporate narrow bandwidth averaging used in average power sensors Signals with digital pulse or other forms of amplitude modulation may introduce measurement...

Страница 195: ...r Also the power meter automatically configures the averaging as shown in Figure 6 120 Figure 6 120E Series CW sensor auto averaging settings 10 dB 10 dB Maximum Sensor Power Minimum Sensor Power Powe...

Страница 196: ...Meters User s Guide Default Channel Setup When an E Series E4410 power sensor is connected the following Channel Setup is automatically configured Carrying out a Preset returns the channel to this co...

Страница 197: ...calibration factors enables you to achieve improved measurement accuracy This section describes making continuous wave measurements using the E4410 E Series power sensors Making a measurement require...

Страница 198: ...Use the numeric keypad to enter the required value in the Frequency pop up window Figure 6 122Frequency pop up 7 Confirm your choice by pressing or 8 Press key to close the Channel Setup screen Now m...

Страница 199: ...s 7 Using 8480 Series Power Sensors Introduction 174 Power Meter Configuration 175 Measurement Accuracy 179 Frequency Specific Calibration Factors 180 Sensor Calibration Tables 184 This chapter descri...

Страница 200: ...le the 110GHz W8486A or the 44 dBm 8482B However they do not have their calibration factors stored in EEPROM unlike all E Series and require that you use default calibration tables or manually enter t...

Страница 201: ...n Figure 7 123 are automatically configured Figure 7 1238480 Series auto averaging settings 10 dB 10 dB Maximum Sensor Power Minimum Sensor Power Power Sensor Dynamic Range 10 dB 10 dB 1 2 3 4 1 1 1 8...

Страница 202: ...911A 1912A P Series Power Meters User s Guide Default Channel Setup Figure 7 124 shows the Channel Setup configured automatically Presetting returns the power meter to this configuration Figure 7 1248...

Страница 203: ...ct to the POWER REF Remove this adapter before making measurements R8486A Q8486A V8486A W8486A R8486D Q8486D These waveguide power sensors have two connectors Use the N Type connector to calibrate the...

Страница 204: ...8487 60001 to connect to the POWER REF Remove this adapter before making measurements 8487D Prior to calibration an Agilent 11708A 30 dB reference attenuator and an APC 2 4 f to 50 m N Type adapter 08...

Страница 205: ...vide two methods of using the calibration factors inputting the individual calibration factor for a frequency prior to making the measurement or using sensor calibration tables If you are making most...

Страница 206: ...pressing The value is displayed under the channel softkey Does this setting match the value for the sensor The power sensor reference calibration factor can normally be found above the calibration fac...

Страница 207: ...and the channel softkey to start the calibration routine The Calibrating pop up is then displayed Now set the sensor calibration factor for the frequency of the signal you want to measure 9 Check the...

Страница 208: ...sor body 10 To change the settings use the and keys to highlight the Cal Fac value field and press to display the Cal Factor pop up Use the numeric keypad to enter the required value in the Cal Factor...

Страница 209: ...t the power sensor to the POWER REF output Press and the channel softkey to start the calibration routine The Calibrating pop up is then displayed Press The value is displayed on the Cal Fac field Use...

Страница 210: ...a set of 9 predefined sensor calibration tables plus a 100 default table The data in these tables is based on statistical averages for a range of Agilent Technologies power sensors Your own sensor wil...

Страница 211: ...d press to highlight Figure 7 128Sensor table selected 3 Press to complete the selection of the calibration factor table 4 Press again to display the measurement screen Figure 7 129 shows which offset...

Страница 212: ...ration table display NOTE If the measurement frequency does not correspond directly to a frequency in the sensor calibration table the power meter calculates the calibration factor using linear interp...

Страница 213: ...of 80 frequency points To view the calibration tables currently stored in the power meter press The Sensor Tbls screen is displayed as shown in Figure 7 128 1 DEFAULT is a sensor calibration table wh...

Страница 214: ...able you want to edit 2 Rename the table 3 Enter the frequency and offset pairs 4 Save the table Procedure First select the table you want to edit as follows 1 Press to display the Sensor Tbls screen...

Страница 215: ...table title using the and keys Press and use the and keys to select and change the characters in the Table Name pop up to create the name you want to use Figure 7 133Edit table title pop up Pressing...

Страница 216: ...ou require 4 When you have finished editing the table press to save the table Enter NOTE A calibration factor in the range of 1 to 150 can be entered The following rules apply to naming sensor calibra...

Страница 217: ...MHz 97 5 4 GHz 98 1 GHz 97 2 5 GHz 97 7 2 GHz 96 4 6 GHz 97 4 3 GHz 93 7 GHz 97 1 4 GHz 91 8 GHz 96 6 Agilent 8481D 9 GHz 96 2 RCF 99 10 GHz 95 4 50 MHz 99 11 GHz 94 9 500 MHz 99 5 12 4 GHz 94 3 1 GHz...

Страница 218: ...z 93 7 25 GHz 92 4 33 GHz 93 7 26 GHz 92 2 34 GHz 94 9 26 5 GHz 92 1 34 5 GHz 94 5 Agilent R8486D 35 GHz 94 4 RCF 97 6 36 GHz 93 7 50 MHz 97 6 37 GHz 94 9 26 5 GHz 97 1 38 GHz 93 5 27 GHz 95 3 39 GHz...

Страница 219: ...Hz 98 3 46 GHz 85 8 10 GHz 98 3 47 GHz 85 4 11 GHz 98 1 48 GHz 83 2 12 GHz 97 9 49 GHz 81 6 13 GHz 98 50 GHz 80 2 14 GHz 98 2 Agilent Q8486A 15 GHz 97 7 RCF 100 16 GHz 96 8 50 MHz 100 17 GHz 97 33 5 G...

Страница 220: ...7 Using 8480 Series Power Sensors 194 N1911A 1912A P Series Power Meters User s Guide THIS PAGE HAS BEEN INTENTIONALLY LEFT BLANK...

Страница 221: ...uction 196 Power Meter Configuration Changes 198 Default Channel Setup 199 N8480 Series Sensors Connection Requirements 200 N8480 Series Power Sensors excluding Option CFT 201 N8480 Series Power Senso...

Страница 222: ...r and lower range Table 8 14 Power range in the Range setting Meanwhile the N8480 sensors with Option CFT only measure power levels from 35 dBm to 20 dBm 1 W to 100 mW in single range Similiar to the...

Страница 223: ...ive power range A models 35 dBm to 20 dBm N8481A N8482A N8485A N8487A and N8488A B models 5 dBm to 44 dBm N8481B and N8482B H models 15 dBm to 35 dBm N8481H and N8482H Waveguide models 35 dBm to 20 dB...

Страница 224: ...y configured Figure 8 134Auto averaging settings Sensor Power Minimum Sensor Dynamic Range 1 2 3 4 1 1 2 8 Resolution Setting Number of Averages 2 2 4 32 2 4 32 2 2 16 256 2 8 128 128 Maximum 4 64 256...

Страница 225: ...hen a N8480 Series power sensor is connected the following Channel Setup is automatically configured carrying out a Preset returns the channel to this configuration Figure 8 135N8480 Series sensor exc...

Страница 226: ...attenuator Prior to calibration this attenuator must be removed Replace the attenuator before making measurements N8485A This power sensor requires an APC 3 5 f to 50 m N Type adapter 08485 60005 to...

Страница 227: ...matically Using calibration factors enables you to achieve improved measurement accuracy This section describes making continuous wave measurements using the N8480 Series power sensors excluding Optio...

Страница 228: ...Use the numeric keypad to enter the required value in the Frequency pop up window Figure 8 137Frequency pop up 8 Confirm your choice by pressing or 9 Press key to close the Channel Setup screen Now ma...

Страница 229: ...ng sensor calibration tables If you are making most of your measurements at a single frequency or in a narrow range of frequencies entering a specific calibration factor is a more effective method Onl...

Страница 230: ...n normally be found above the calibration factors table on the power sensor body 4 To change the settings press the channel The reference calibration factor pop up window is displayed as shown in Figu...

Страница 231: ...r sensor body 10 To change the settings use the and keys to highlight the Cal Fac value field and press to display the Cal Factor pop up Use the numeric keypad to enter the required value in the Cal F...

Страница 232: ...cy Disconnect the power sensor from any signal source Press and the channel softkey Use the numeric keypad to enter 99 8 in the Ref Cal Factor pop up window Press to complete the entry Press and the c...

Страница 233: ...Use the numeric keypad to enter 97 6 in the Cal Factor pop up window Press to complete the entry Connect the power sensor to the signal to be measured The corrected measurement result is displayed NOT...

Страница 234: ...a set of 9 predefined sensor calibration tables plus a 100 default table The data in these tables is based on statistical averages for a range of Agilent Technologies power sensors Your own sensor wil...

Страница 235: ...ently selected The Sensor Tbls screen is shown in Figure 8 141 Procedure Select sensor calibration table as follows 1 Press 2 Use the and keys to highlight one of the 20 table titles and press to high...

Страница 236: ...up window 7 To confirm your choice press the appropriate unit softkey 8 Connect the power sensor to the signal to be measured 9 The corrected measurement result is now displayed NOTE When no data is c...

Страница 237: ...ncy calibration table display NOTE When display mode is chosen the frequency you entered and the sensor table identifier is displayed in the upper window Also pressing displays the frequency you enter...

Страница 238: ...requency points To view the calibration tables currently stored in the power meter press The Sensor Tbls screen is displayed as shown in Figure 8 141 Table 8 16 Installed power sensor models 1 DEFAULT...

Страница 239: ...is shipped from the factory Editing frequency dependent offset tables requires the following steps 1 Identify and select the table you want to edit 2 Rename the table 3 Enter the frequency and offset...

Страница 240: ...e table title using the and keys Press and use the and keys to select and change the characters in the Table Name pop up to create the name you want to use Figure 8 146Edit table title pop up Pressing...

Страница 241: ...you require 4 When you have finished editing the table press to save the table Enter NOTE A calibration factor in the range of 1 to 150 can be entered The following rules apply to naming sensor calibr...

Страница 242: ...8 Using N8480 Series Power Sensors 216 N1911A 1912A P Series Power Meters User s Guide THIS PAGE HAS BEEN INTENTIONALLY LEFT BLANK...

Страница 243: ...Series Power Meters User s Guide Agilent Technologies 9 ComplementaryCumulativeDistribution Function CCDF Introduction 218 Setting the CCDF Table 219 This chapter describes the CCDF feature of the P...

Страница 244: ...e the average signal power while the Y axis represents the percent of time the signal spends at or above the power level specified by the X axis The most important application of power CCDF curves is...

Страница 245: ...le is shown in windowed format by default However you can press once for expanded format and twice for full screen Windowed CCDF Table The CCDF table is shown in windowed format by default Figure 9 14...

Страница 246: ...so vary the sample count of the CCDF table To set the sample count press then You can also set the mode to single or continuous In single mode the graph and table readings will stop refreshing after t...

Страница 247: ...ries Power Meters User s Guide 221 Full Screen CCDF Table Press twice for a full screen view of the CCDF table Figure 9 149CCDF table in full screen display NOTE Statistical Settings can also be acces...

Страница 248: ...ition the difference between markers on Channel A Channel B Gaussian and Reference traces can be observed To view the CCDF trace press and Step 1 Display the Trace Press and select the trace that you...

Страница 249: ...to select Marker 1 or Marker 2 Press or to select the trace that you wish the marker to be placed on Figure 9 151CCDF trace display with Marker Trace menu Press to return to the Marker Ctrl menu Pres...

Страница 250: ...ak to average ratio for the respective channel that you have selected Step 3 Setting the Scale Div You are allowed to optimize the view of the trace by setting the appropriate scale div The lowest lim...

Страница 251: ...9 152Scale Div pop up Step 4 Store the Trace for Reference The function of is to save the trace of either Channel A or Channel B into the volatile memory of the power meter Press under the menu to ret...

Страница 252: ...9 CCDF 226 N1911A 1912A P Series Power Meters User s Guide Figure 9 153Selection of CCDF trace to be stored as a reference trace...

Страница 253: ...nce Self Test 228 Error Messages 232 Operator Maintenance 243 Contacting Agilent Technologies 245 Erasing Memory Data 248 Returning Your Power Meter for Service 249 Agilent Sales and Service Offices 2...

Страница 254: ...s performed automatically when the power meter is turned on and takes approximately 10 seconds to complete As the power on self test occurs the message Testing appears next to the name of the test whi...

Страница 255: ...el DAP Check As each test takes place the name of the test is listed on the screen While a test is running the message Testing appears beside the name of the test As each stage of the test is complete...

Страница 256: ...h test takes place the name of the test is listed on the screen While a test is running the message Testing appears beside the name of the test As each stage of the test is completed the message Testi...

Страница 257: ...value which is written is read back correctly a pass is recorded otherwise a fail is recorded The liquid crystal display light emitting diode LCD LED control circuits are tested by making separate vo...

Страница 258: ...status line at the top of the display In addition the errors are also written to the error queue If there are any errors in the error queue the front panel error indicator is displayed as shown in Fi...

Страница 259: ...ny time the queue overflows the most recent error is discarded When the errors are read they are removed from the error queue This opens a position at the end of the queue for a new error message if o...

Страница 260: ...lank space or you may have used a blank space instead of a comma For example OUTP ROSC 1 105 GET not allowed A Group Execute Trigger GET is not allowed within a command string 108 Parameter not allowe...

Страница 261: ...o large A numeric parameter was found whose exponent was larger than 32 000 For example SENS COUN 1E34000 124 Too many digits A numeric parameter was found whose mantissa contained more than 255 digit...

Страница 262: ...of parameters to verify that you have used a valid parameter type For example LIM STAT ON 161 Invalid block data A block data element was expected but was invalid for some reason For example DDT 15FET...

Страница 263: ...y of conflicting conditions The following list gives a few examples of where this error may occur If the READ parameters do not match the current settings If you are in fast mode and attempting to swi...

Страница 264: ...age 230 Data corrupt or stale Please zero Channel A When CAL 1 2 RCAL is set to ON and the sensor currently connected to Channel A has not been zeroed then any command which would normally return a me...

Страница 265: ...Input Overload ChA The power input to Channel A exceeds the power sensor s maximum range 231 Data questionable Input Overload ChB The power input to Channel B exceeds the power sensor s maximum range...

Страница 266: ...is for use with CW signals only 310 System error Sensor EEPROM Read Failed critical data not found or unreadable This indicates a failure with your E Series or N8480 Series power sensor Refer to your...

Страница 267: ...ge 245 for details of what to do with your faulty power meter 330 Self test Failed Measurement Channel Fault 330 Self test Failed Measurement Channel A Fault 330 Self test Failed Measurement Channel B...

Страница 268: ...fer is cleared when power has been off or after RST reset command has been executed 420 Query UNTERMINATED The power meter was addressed to talk that is to send data over the interface but a command h...

Страница 269: ...embly on the rear panel For all voltages the power meter uses a 250 V F3 15 AH 20 mm fast blow fuse with high breaking capacity Agilent part number 2110 0957 Replacing the Power Line Fuse 1 Slide the...

Страница 270: ...10 Maintenance 244 N1911A 1912A P Series Power Meters User s Guide Figure 10 156Replacing the fuse In line Fuse Spare Fuse...

Страница 271: ...eter for service please make the checks listed in Check the Basics on page 245 If you still have a problem please read the warranty printed at the front of this guide If your power meter is covered by...

Страница 272: ...rror messages Check operation by performing the self tests Check with a different power sensor Instrument serial numbers Agilent Technologies makes frequent improvements to its products to enhance the...

Страница 273: ...refix letters indicate the country of manufacture This code is based on the ISO international country code standard and is used to designate the specific country of manufacture for the individual prod...

Страница 274: ...r or calibration of all data stored in it The memory data erased includes the save recall states and power on last states The following procedure explains how to do this 1 Press the key 2 Press 3 Pres...

Страница 275: ...e carton must be both large enough and strong enough to accommodate the power meter and allow at least 3 to 4 inches on all sides of the power meter for packing material Surround the power meter with...

Страница 276: ...1912A P Series Power Meters User s Guide Seal the shipping container securely with strong nylon adhesive tape Mark the shipping container FRAGILE HANDLE WITH CARE to ensure careful handling Retain cop...

Страница 277: ...es tel 1 800 829 4444 CANADA Agilent Technologies Canada Inc Test Measurement tel 1 877 894 4414 EUROPE Agilent Technologies Test Measurement European Marketing Organization tel 31 20 547 2000 JAPAN A...

Страница 278: ...10 Maintenance 252 N1911A 1912A P Series Power Meters User s Guide THIS PAGE HAS BEEN INTENTIONALLY LEFT BLANK...

Страница 279: ...pecifications 256 Measurement Characteristics 259 Rear Panel Inputs and Output Connections 262 1 mW Power Reference 263 Environmental Conditions 264 Physical Characteristics 265 Regulatory Information...

Страница 280: ...ons are not warranted They describe product performance that is useful in the application of the power sensors by giving typical but non warranted performance parameters These characteristics are show...

Страница 281: ...specifications are referred to as typical Conditions The power meter and sensor meet its specifications when Stored for a minimum of two hours at a stable temperature within the operating temperature...

Страница 282: ...ensor 50 MHz to 18 GHz N1922A P Series wideband power sensor 50 MHz to 40 GHz Dynamic Range 35 dBm to 20 dBm 500 MHz 30 dBm to 20 dBm 50 MHz 500 MHz Measurements The following Power measurements are p...

Страница 283: ...sensors 1 Meter Uncertainty Average Power Measurement Accuracy2 N1921A 0 2 dB or 4 5 N1922A 0 3 dB or 6 7 1 For specifications when using an 8480 N8480 Series and E Series sensors except E9320A range...

Страница 284: ...Command Language SCPI standard interface commands3 GPIB Compatibility SH1 AH1 T6 TE0 L4 LE0 SR1 RL1 PP1 DC1 DT1 C0 Timebase Range 2 ns to 100 msec div Accuracy 10 ppm Jitter 1 ns Video Bandwidth 30 M...

Страница 285: ...r 5 ns rms External TTL Trigger Input High 2 4 V Low 0 7 V Latency 4 90 ns 10 ns Minimum trigger pulse width 15 ns Minimum trigger repetition period 50 ns Impedance 50 Jitter 5 ns rms External TTL Tri...

Страница 286: ...andwidth 7 The Minimum Pulse Width is the recommended minimum pulse width viewable on the power meter where power measurements are meaningful and accurate but not warranted 8 Based on 10 samples per p...

Страница 287: ...Series meter and sensor combination can accurately measure a signal with a known rise time of 13 ns The measured rise time is the root sum of the squares RSS of the signal under test rise time and the...

Страница 288: ...0 10 100BaseT LAN Interfaces allow communication with an external controller Trigger Input Input has TTL compatible logic levels and uses a BNC connector Trigger Out Output provides TTL compatible lo...

Страница 289: ...8480 Series and the N8480 Series power sensors The P Series sensors are automatically calibrated hence do not need this power reference for calibration Power Output 1 00 mW 0 0 dBm Factory set to 0 4...

Страница 290: ...89 336 EEC Operating Environment Storage Conditions Temperature 0 oC to 55 oC Maximum Humidity 95 at 40 oC non condensing Minimum Humidity 15 at 40 o C non condensing Maximum Altitude 3 000 meters 9...

Страница 291: ...Dimensions The following dimensions exclude front and rear panel protrusions 88 5 mm H x 212 6 mm W x 348 3 mm D 3 5 in x 8 5 in x 13 7 in Weight Weight Net N1911A 3 5 kg 7 7 lb approximately N1912A 3...

Страница 292: ...92 In order to preserve the EMC performance of the product any cable which becomes worn or damaged must be replaced with the same type and specification The product also meets the following EMC standa...

Страница 293: ...w and Off filters The Off video bandwidth setting provides the warranted rise time and fall time specification and is the recommended setting for minimizing overshoot on pulse signals Rise Time Fall T...

Страница 294: ...two tone RF input Figure 11 159 refers to the relative error in peak to average ratio measurements as the tone separation is varied The measurements were performed at 10 dBm with power sensors with 1...

Страница 295: ...er sample is reduced by applying the meter video bandwidth filter setting High Medium or Low If averaging is implemented this will dominate any effect of changing the video bandwidth Sensor Model Zero...

Страница 296: ...ect of time gating on measurement noise The measurement noise on a time gated measurement depends on the time gate length 100 averages are carried out every 1 s of gate length The Noise per Sample con...

Страница 297: ...6 4866 China tel 800 810 0189 fax 800 820 2816 Europe tel 31 20 547 2111 Japan tel 81 426 56 7832 fax 81 426 56 7840 Korea tel 080 769 0800 fax 080 769 0900 Latin America tel 305 269 7500 Taiwan tel 0...

Отзывы: