44 / 99
www.xovis.com
When hovering over the count elements within the list, the element gets hightlighted both
within the list and within the scene. When clicking on a specific element, it gets marked red
both within the list and within the scene.
The count values of the count lines can be reset to 0 by clicking o
n the small blue “reset”
button located in the header of the “Counts” box. Resetting the count values can be of use to
do a measurement starting at a specific point in time.
Resetting the count values can influence additional software that depends on the sensors
count data. However, as the sensor stores the count line values every minute, the stored
statistics will only be influenced for the last single minute.
3.2.8.3
24h live statistics
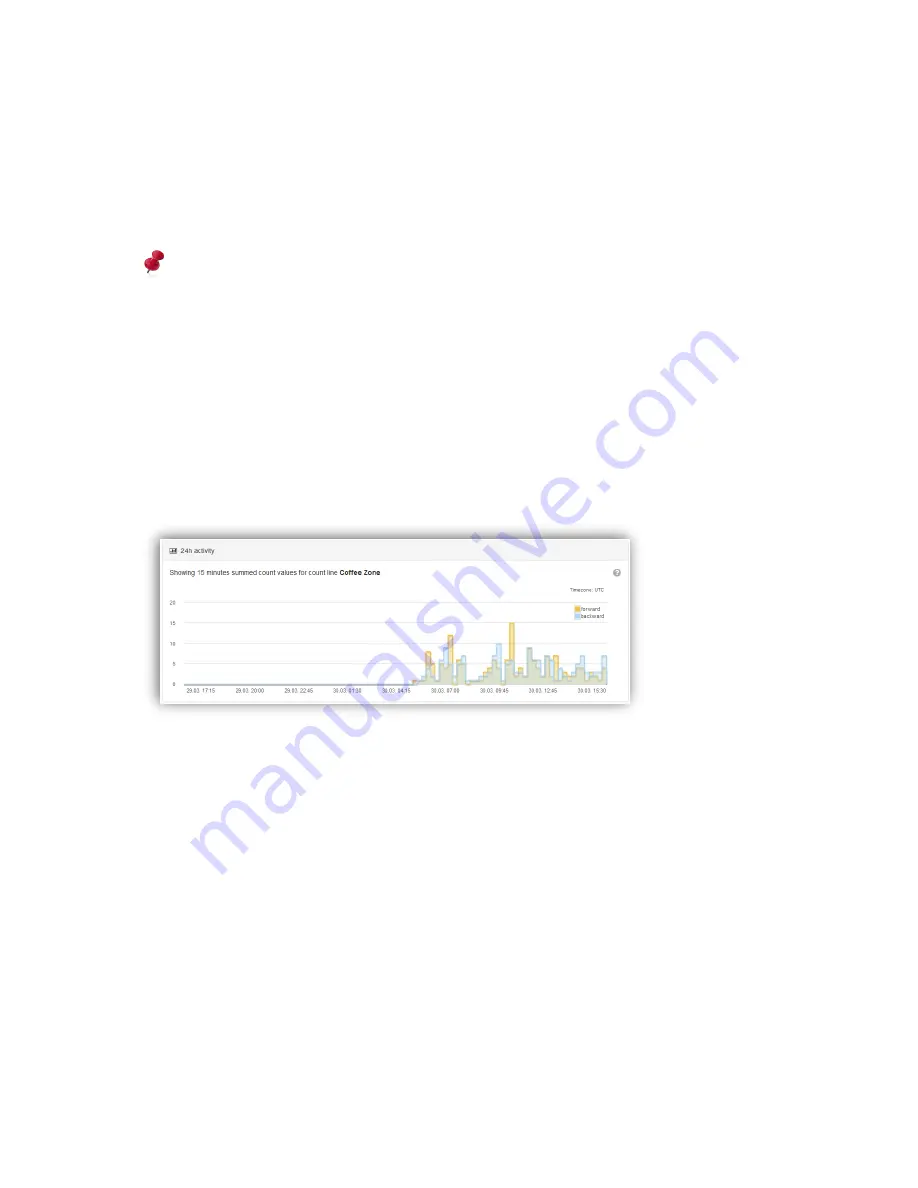
The 24h activity shows measurements of a specific count item of the past day. Per default,
the chart shows data for the top most count item (if at least one if defined). When clicking on
a count item, be it a line or a zone, the chart will display the corresponding data.
For count lines, both, the forward and the backward counts are displayed within the chart.
The values are summed up to 15 minute bins.
For count zones, in case the data persistence feature has been activated (see 3.2.7.9.8), the
occupancy as well as dwell times are available. The individual charts for occupancy, dwell
time statistics and dwell time distribution are accessible by selecting the respective tab:
Summary of Contents for PC Series
Page 1: ...PC Series User manual...


