49 / 99
www.xovis.com
3.2.9.1
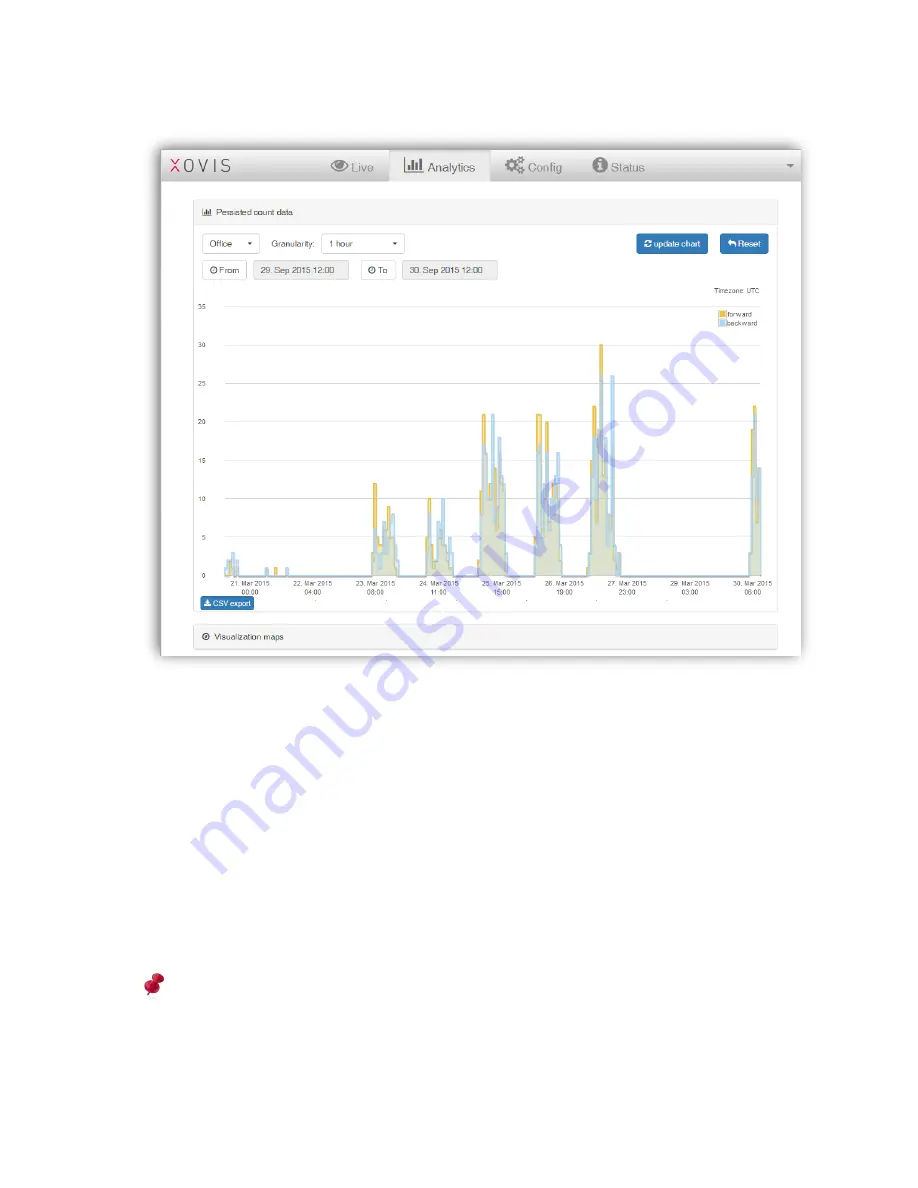
Persisted count data
To display the count data based on a specific time frame, start by selecting the count item of
interest in the first drop-down menu. Both, count lines as well as count zones with activated
data persistence are listed.
The second drop-down menu allows the user to choose a granularity. The following
granularities are available: 1 minute, 5 minutes, 15 minutes, 30 minutes, 1 hour, 6 hours, 12
hours, 1 day.
With the “From” and “To” buttons, the time range can be specified on a minute basis.
After selecting the properties, the chart can be updated by clicking on the “update chart”
button.
To reset the properties to the default values and display
the chart accordingly, the “reset”
button can be clicked.
The chart in the statistics view can only display 400 data points in a meaningful manner.
When choosing a granularity and period which would lead to more than 400 data points, a
warning message will be displayed and the granularity will automatically be reduced to the
next coarse value that will lead to 400 values at maximum (see Figure 43).
Summary of Contents for PC Series
Page 1: ...PC Series User manual...


