


56 / 99
www.xovis.com
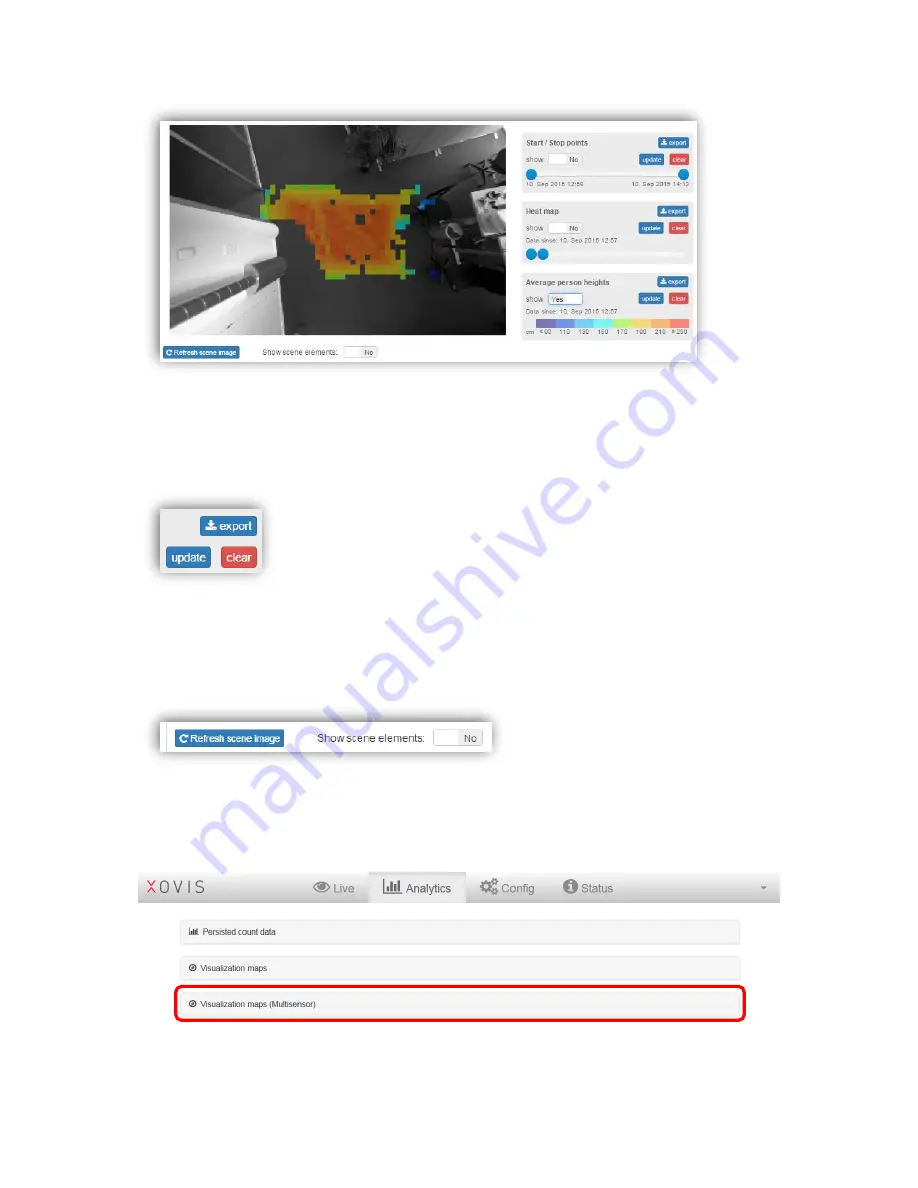
All three maps can be exported to a PNG image. The chosen settings like the time period for
start/stop points or the saturation for the heat map are also applied to the exported images.
All maps can
be reset by clicking on “clear”. The user is the asked to confirm the reset
. As
these maps are not updated live, for refreshing them
the button “update” has to be clicked.
All below the map view, the button “Refresh scene image” allows to re
-capture the displayed
scene image. Toggling the switch “Show scene elements” allows to
overlay or hide count
lines and count zones. This is very helpful to verify proper drawing of the count items, e.g.
when looking at the start/stop points.
3.2.9.3
Multisensor visualization maps
After configuring a multisensor according chapter “3.2.10.4.7 Multisensor” a third analytics
bar appears:
There are the same features accessible like for a single sensor:
-
Start / Stop points
Summary of Contents for PC Series
Page 1: ...PC Series User manual...


