5.- SOFTWARE DESCRIPTION
- 52 -
5.4.- Test analysis
The analysis of a test is made up of a series of screens that show the technical data on
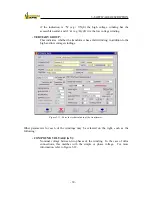
the transformer and graphics and tables with the results obtained. The Recovery Voltage
application screen is the one in figure 5-28 and the one of the Insulation Resistance
application would be she same but without the icons: Recovery Voltage and Peak Time.
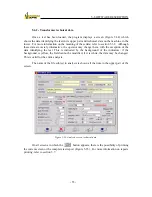
Figure 5-28: Process of analysis of the test results.
To perform an analysis, click on the “
Analysis
” button
on the main menu.
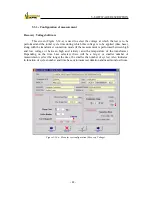
This button is used to begin a new analysis, regardless of the degree of execution of the
program. If a test was being performed previously, the system will ask for confirmation of
the step (Figure 5-29).
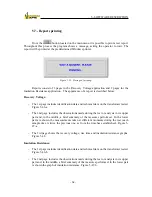
Figure 5-29: Confirmation of change to analysis.
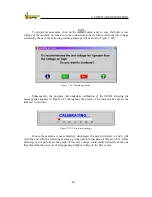
If the analysis of a previous test were already under way, then nothing will happen if
this is interrupted, unless a value had been modified. In this case, Figure 5-30 would be
shown.
Summary of Contents for UM2B
Page 2: ......
Page 67: ...5 SOFTWARE DESCRIPTION 65 Figure 5 46 a First page of the report Recovery Voltage ...
Page 68: ...5 SOFTWARE DESCRIPTION 66 Figure 5 47 a Second page of report Recovery Voltage ...
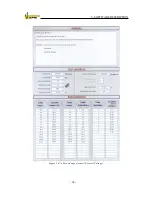
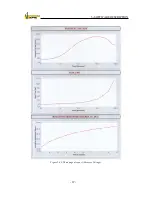
Page 69: ...5 SOFTWARE DESCRIPTION 67 Figure 5 48 Third page of report Recovery Voltage ...
Page 70: ...5 SOFTWARE DESCRIPTION 68 Figure 5 46 b First page of the report Insulation Resistance ...
Page 71: ...5 SOFTWARE DESCRIPTION 69 Figure 5 47 b Second page of the report Insulation Resistance ...
Page 87: ...8 TECHNICAL SUPPORT 85 Description of fault Materials returned on of of the year Table 8 1 ...
Page 95: ...APPENDIX B CONTROL SOFTWARE 93 APPENDIX A CE CONFORMITY DECLARATION ...


