5.- SOFTWARE DESCRIPTION
- 59 -
5.4.4.- Peak time
This screen is very similar to the previous one , but instead of showing the recovery
voltage, it is shown the time (a dot) it takes to the dielectric to arrive to each cycle‟s
maximum recovery voltage sample. In this case the operator cannot move around the
graphic, but – as in the previous case – the rise time to the recovery maximum at different
cycles of the test is shown to the right.
Figure 5-41: Analysis: Recovery peak time.
Summary of Contents for UM2B
Page 2: ......
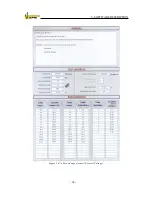
Page 67: ...5 SOFTWARE DESCRIPTION 65 Figure 5 46 a First page of the report Recovery Voltage ...
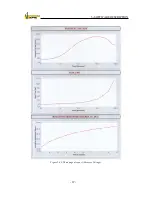
Page 68: ...5 SOFTWARE DESCRIPTION 66 Figure 5 47 a Second page of report Recovery Voltage ...
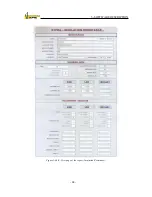
Page 69: ...5 SOFTWARE DESCRIPTION 67 Figure 5 48 Third page of report Recovery Voltage ...
Page 70: ...5 SOFTWARE DESCRIPTION 68 Figure 5 46 b First page of the report Insulation Resistance ...
Page 71: ...5 SOFTWARE DESCRIPTION 69 Figure 5 47 b Second page of the report Insulation Resistance ...
Page 87: ...8 TECHNICAL SUPPORT 85 Description of fault Materials returned on of of the year Table 8 1 ...
Page 95: ...APPENDIX B CONTROL SOFTWARE 93 APPENDIX A CE CONFORMITY DECLARATION ...


