Perform a measuring campaign
62/92
6.7 Evaluation of readings
Before starting the evaluation select an adequate model in the
configuration menu to fit the curves (see chapter Configure the
campaign 6.3). An evaluation is only possible if the campaign has
been stopped and appropriate start and stop points are set. Pull the
start and stop line to the proper position with the cursor.
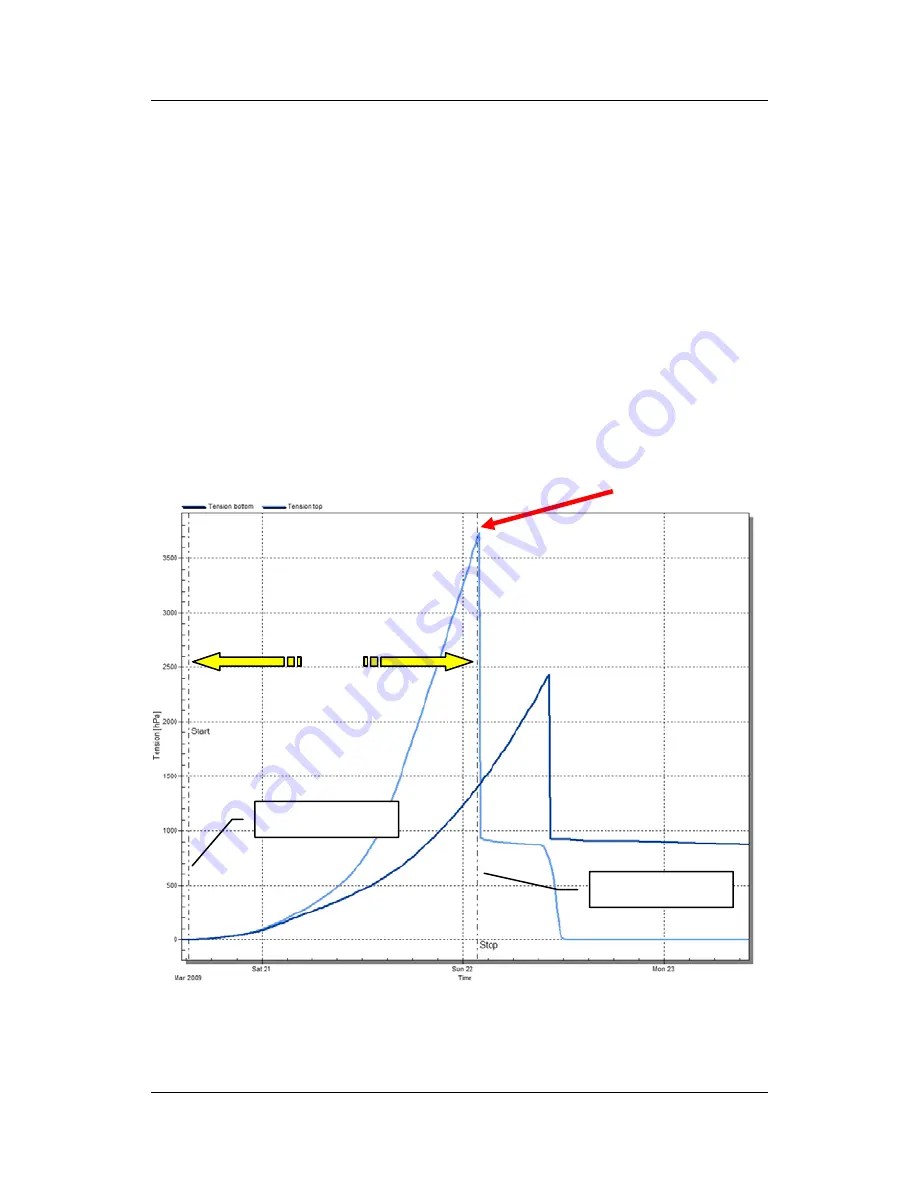
Start:
the tension values are constantly horizontal for a certain time
period in the saturated range.
Stop:
must be in the range where both curves are still rising - see
red arrow in fig. 50.
Move the cursor over the graph and click the right mouse button to
print, export or enlarge the graph (fig. 50).
Start line
Stop line
Fig. 50: tensioVIEW calculating values


