


Entering the Profiling Environment
10-4
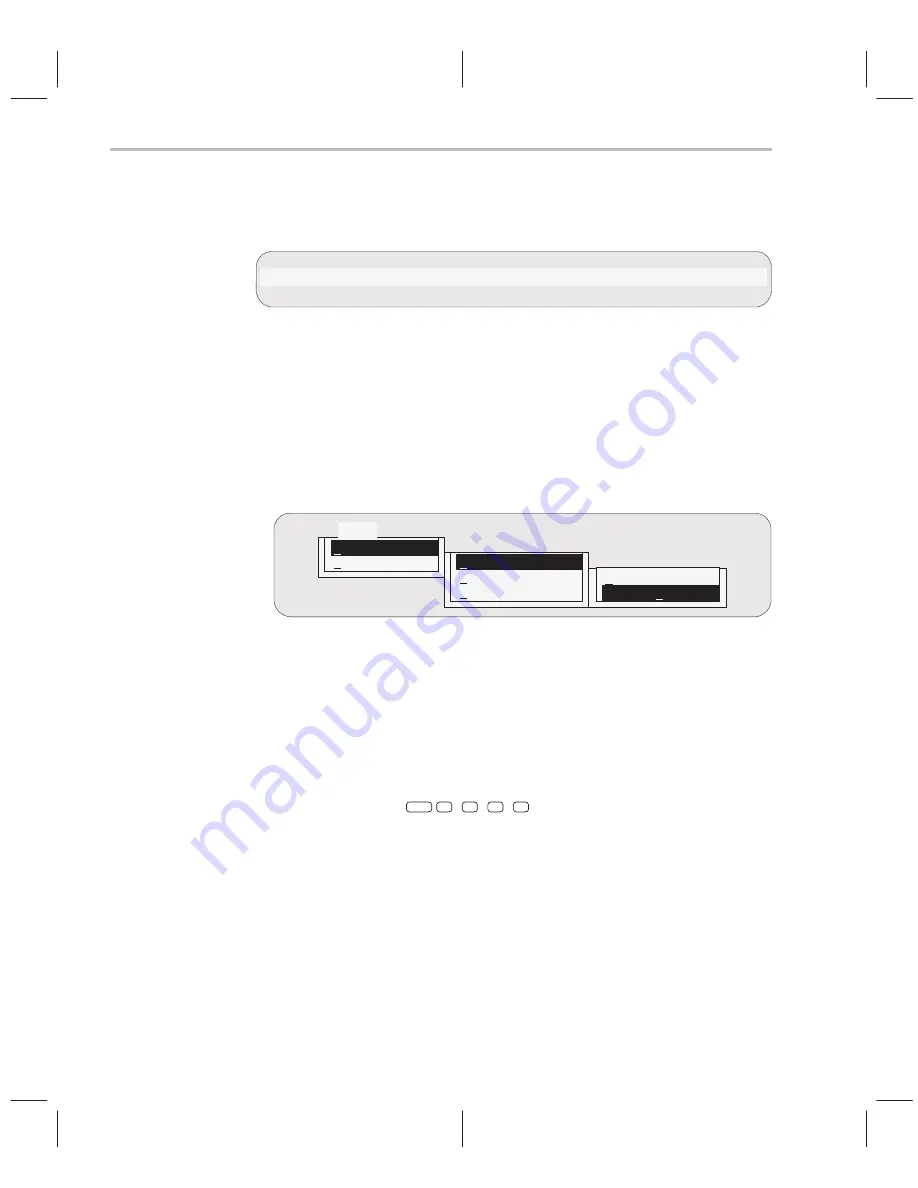
Using pulldown menus in the profiling environment
The debugger displays a different menu bar in the profiling environment:
mAp
Mark
Enable
Disable
Unmark
View
Stop–points
Profile
Load
The Load menu corresponds to the Load menu in the basic debugger environ-
ment. The mAp menu provides memory map commands available from the
basic Memory menu. The other entries provide access to profiling commands
and features.
The profiling environment’s pulldown menus operate like the basic debugger
pulldown menus. However, several of the menus have additional submenus.
A submenu is indicated by a
>
character following a menu item. For example,
here’s one of the submenus for the Mark menu:
Mark
C level
>
Asm level
>
Line areas
>
Range areas
>
Function areas >
Explicitly
in one Function
C level
>
Line areas
>
Explicitly
in one Function
Chapter 11,
Summary of Commands and Special Keys, shows which debug-
ger commands are associated with the menu items in the basic debugger pull-
down menus. Because the profiling environment supports over 100 profile-
specific commands, it’s not practical to show the commands associated with
the menu choices. Here’s a tip to help you with the profiling commands: the
highlighted menu letters form the name of the corresponding debugger com-
mand. For example, if you prefer the function-key approach to using menus,
the highlighted letters in Mark
→
C level
→
Line areas
→
in one Function show
that you could press
ALT
M
,
C
,
L
,
F
. This also shows that the correspond-
ing debugger command is MCLF.
Summary of Contents for TMS320C6 Series
Page 10: ...x ...
Page 20: ...xx ...
Page 118: ...4 20 ...
Page 144: ...6 16 ...
Page 164: ...7 20 ...
Page 170: ...8 6 ...
Page 284: ...B 18 ...
Page 290: ...C 6 ...


