www.spacelabshealthcare.com
9 - 3
X P R E Z Z O N
A N D
Q U B E
O
P E R A T I O N S
M
A N U A L
T
R E N D S
6
Timeline—Used to access all of the data available for the current
patient. The time of the displayed data shows by the location of the
orange bar on the timeline. Use the inner arrow buttons to move the
display a few minutes forward or backward. Use the outer arrow
buttons to move the display page forward and backward.
7
Flag cursor—Shows data values at a specific point in time. To enable
and use the Flag cursor, refer
To show, move, or remove the Flag
8
Scrolling buttons for the tabular trend section of the Trends window.
Use the inner two arrows to move a row up or down in the section. Use
the outer arrow buttons to move to the top or bottom of the tabular
section.
9
Close button.
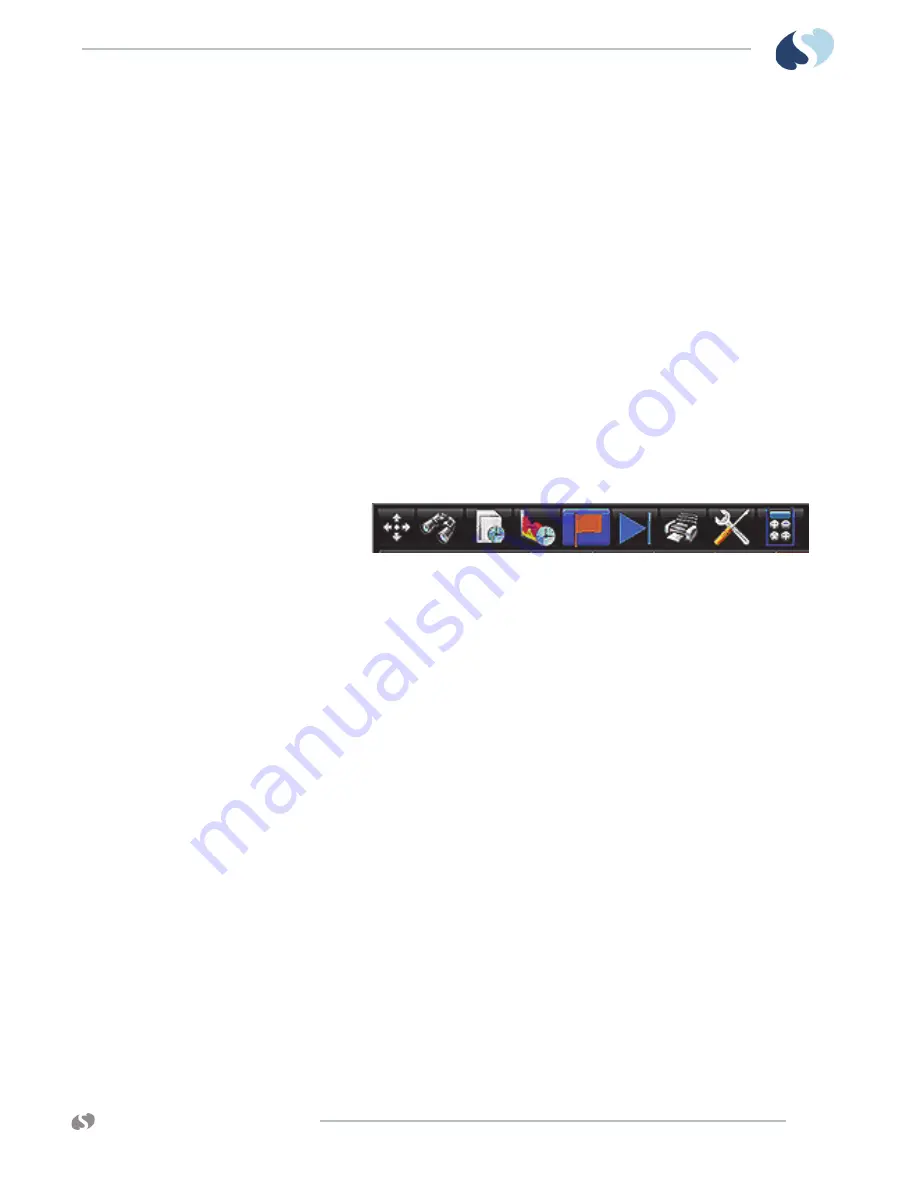
Trends toolbar
A toolbar with of nine icons shows across the top of the Trends window. You use
these icons to navigate the Trends window and to configure how measurements are
shown.
Figure 9-2 Trends toolbar
The Trends toolbar consists of the following icons and their functions, from left to
right:
1
Size: Changes the size of the Trends window.
2
View: Shows a list of the trend views that are currently available.
3
Interval: Shows a list of interval selections. Applies to tabular format
only.
4
Duration: Shows a list of duration selections. Applies to graphical
format only.
5
Cursor: Changes the Flag cursor from on to off and back. The Flag
cursor, when enabled, automatically shows when a user touches the
graph. It shows the measurement data for the selected point in time.
6
Auto-Refresh: Touch to enable or disable auto refresh for trends data. If
enabled, data updates automatically every minute.
7
Print: Prints the currently shows trends.
8
Setup: Shows the Trends Setup window, which you can use to change
the data within a view.
9
Calcs: Accesses the Calculations window or the drug calculator. Refer to
on page 10-1 for more information.
1
3
4
5
6
7
8
9
2


