background image

Previous Vehicles and Data

Previous Vehicles and Data Menu

56

5.1.2  View Saved Data

Selecting the 

View Saved Data

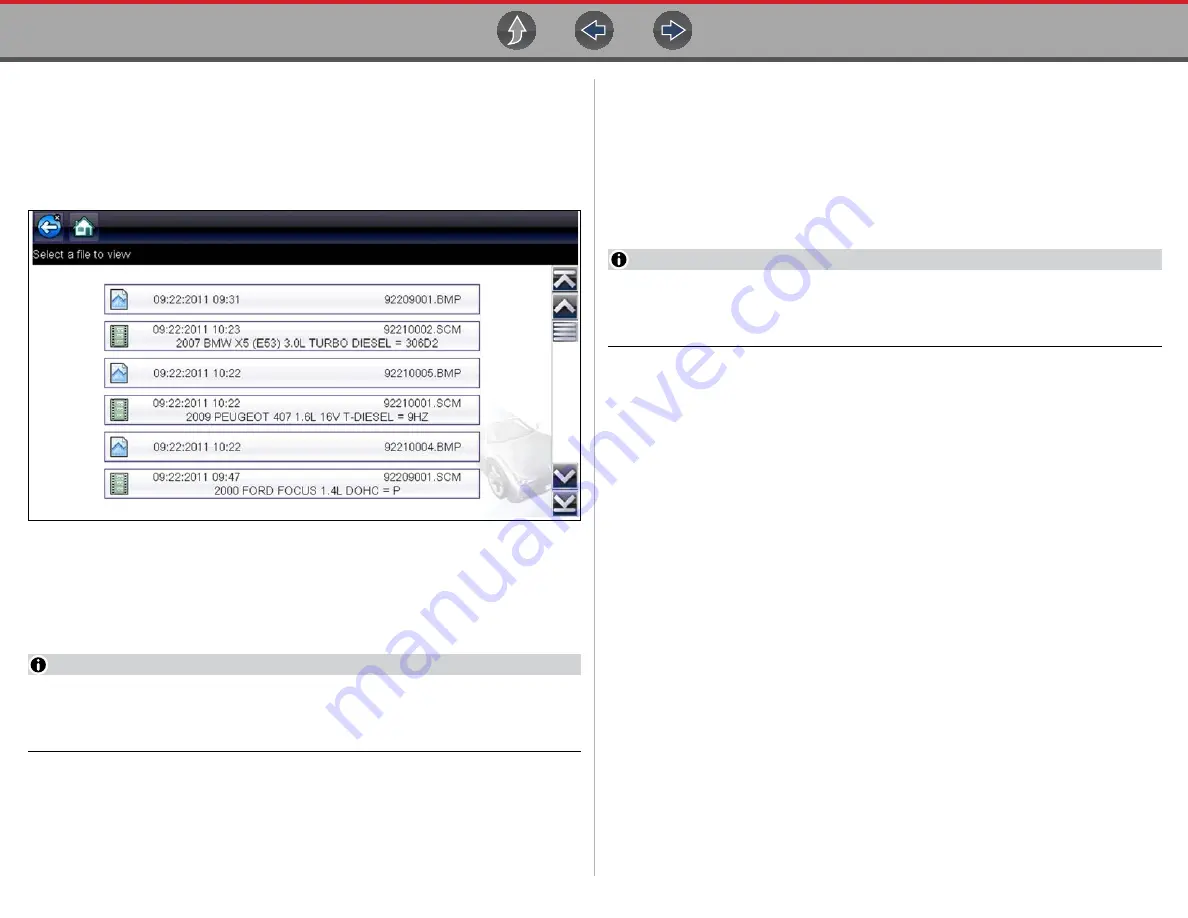
 menu option opens a list of all the saved data 

(movie) files and screen images that are stored in memory. Saved files are listed in 
chronological order by the date and time that they were created with the most 
recent files are at the top of the list.

Figure 5-2 

Saved data list

Saved files can either be opened directly on the Diagnostic Tool, or downloaded to 
a personal computer and opened using ShopStream Connect. Se

Stopping and 

Reviewing Data Files

 on page 34

 and 

Connect-to-PC

 on page 58

 for additional 

information.

NOTE

A maximum of 50 files are displayed. To view all (if more than 50) files stored, 
use ShopStream Connect. See 

Connect-to-PC

 on page 58 for additional 

information. 

z

To review a saved data file or image:

1.

Select 

Previous Vehicles and Data

 from the Home screen.

2.

Select 

View Saved Data

 from the menu.

3.

Select a file to review from the list.

5.1.3  Delete Saved Data

This menu option is used to permanently erase saved files from memory.

z

To delete a saved file:

1.

Select 

Previous Vehicles and Data

 from the Home screen.

2.

Select 

Delete Saved Data

 from the menu.

A list of saved files displays.

NOTE

The Select All/Deselect All and Delete icons become available on the toolbar 
so that you can either delete individual files or clear the entire memory buffer 
all at once.

3.

Select a file from the list and a confirmation message displays.

4.

Select an option from the confirmation message:

OK

—deletes the selected file and returns to the saved files list, which no 

longer includes the deleted file.

Cancel

—returns to the saved files list without deleting the selected file.

5.

Select 

Back

 on the toolbar to return to the Previous Vehicles and Data menu, 

select 

Home

 to return to the Home screen.

Summary of Contents for Vantage Legend

Page 1: ...User Manual ZEETM345A Rev A Start BC ...

Page 2: ...hopStream Connect General Information Maintenance Table of Contents TOC Click a Topic Using Page Controls Previous Vehicles Data Guided Component Tests Scope Multimeter Tools Basic Operation Navigation Customer Support Training ...

Page 3: ...ent Probe optional 13 Temperature Probe Adapter optional 13 Pressure Transducers and Adapters optional 14 Waveform Demonstration Tools optional 14 General Information 15 Scope Multimeter Screen Layout and Features 15 Measurement Out of Range Alert 16 Operation and Controls 16 Test Lead Probe Connection 17 Test Lead Probe Calibration 17 Control Panel and Settings 17 Secondary Ignition Testing 28 Op...

Page 4: ...ect 64 Using SSC Connecting to your PC 64 SSC Main Screen 65 Scanner DataViewer 66 Image Viewer 66 Printing the Code Scan Vehicle System Report 67 Customizing the Code Scan Vehicle System Report 68 Software Upgrades and Updates 70 End User License Agreement 70 Section 8 Maintenance 72 Cleaning and Inspecting the Diagnostic Tool 72 Cleaning the Touch Screen 72 Battery Pack Service 72 Safety 72 Orde...

Page 5: ...ds and test procedures It is important to perform tests in an appropriate and acceptable manner that does not endanger your safety the safety of others in the work area the equipment being used or the vehicle being tested It is assumed that the operator has a thorough understanding of vehicle systems before using this product Understanding of these system principles and operating theories is neces...

Page 6: ...al hazard Safety Message Example Risk of electric shock Prior to recycling the battery pack protect exposed terminals with heavy insulating tape to prevent shorting Disconnect all test leads and turn diagnostic tools off before removing the battery pack Do not attempt to disassemble the battery or remove any component projecting from or protecting the battery terminals Do not expose the diagnostic...

Page 7: ...epresentative for availability of other functions and optional equipment Conventions The following conventions are used Terminology The terms Scanner and Scanner function are used to describe the Scanner Function s of the diagnostic tool Examples Select Scanner from the Home screen From the Scanner main menu select Continue The Scanner function provides many diagnostic tests The term select descri...

Page 8: ...d menu options Example Press the OK button Notes and Important Messages The following messages are used Notes A NOTE provides helpful information such as additional explanations tips and comments Example NOTE For additional information refer to Important IMPORTANT indicates a situation which if not avoided may result in damage to the test equipment or vehicle Example IMPORTANT Do not disconnect th...

Page 9: ...ower Sources page 3 Technical Specifications page 3 1 2 Control Buttons There are four push type control buttons and one thumb pad rocker type multi directional button located on the right side of the Diagnostic Tool All other Diagnostic Tool operations are controlled through the touch screen Figure 1 1 Front view Item Button Description 1 N X or Cancel Push type button To exit a menu or program T...

Page 10: ... shutdown Item Description 1 Battery Status Indicator LED Green battery is fully charged Red battery is charging Amber indicates there is a battery issue correct before operating 2 DC Power Supply Jack AC power supply connection 3 Scope Multimeter Jacks Scope and multimeter lead connections Item Button Description 9 6 1 4 Mini USB Jack USB cable connection used to connect the Diagnostic Tool to a ...

Page 11: ...ower Supply The Diagnostic Tool can be powered from a standard AC outlet using the AC power supply The connector on the end of the output cable of the AC power supply attaches to the DC power supply input jack on top of the Diagnostic Tool Use only the AC power supply provided 1 6 Technical Specifications Item Description Specification Touch Screen Resistive Touch Panel Display 8 0 inch diagonal C...

Page 12: ...ool on 2 1 2 Turning Off IMPORTANT All vehicle communication must be terminated BEFORE turning off the Diagnostic Tool A warning message displays if you attempt to turn the Diagnostic Tool off while communicating with the vehicle Forcing a shut down while communicating may lead to ECM problems on some vehicles Never disconnect the Data Cable when the Diagnostic Tool is communicating with the vehic...

Page 13: ...ome screen icon counterparts in appearance and color The name of the function displays to the right of the icon on some screens A real time clock displays to the left of the power supply icon The clock is powered by a dedicated internal battery so the correct time is maintained even when the main battery pack is discharged Use the Tools function to set the clock and format how time is displayed Se...

Page 14: ...s highlighted or in focus Use the Directional buttons e c b d to highlight the desired function and then press the Y a button to select it Function Name Function Icon Description Guided Component Tests Allows you to perform diagnostic tests for the identified vehicle See Guided Component Tests on page 45 Scope Multimeter Allows you to perform lab scope graphing multimeter and digital multimeter te...

Page 15: ...nd hold a directional button to rapidly scroll through data 2 3 System Messages There are four types of system messages that may be displayed Message Type Description Loading and Connecting Loading and connecting messages display when the Diagnostic Tool is performing an internal operation such as loading a database or initiating a test The message automatically clears once the internal operation ...

Page 16: ...amperage on circuits and components to verify operation The meter displays measurements in a digital numerical format and is typically used for measuring signals that are not rapidly changing The DMM is ideal for performing basic tests on most standard automotive circuits and displays the results in a large easy to see format To use the DMM select the Scope Multimeter icon from the home screen the...

Page 17: ...compared to the lab scope sweep scales that use relatively short time intervals e g milli and micro seconds This allows you to monitor a signal over a longer period of time when looking for erratic glitches or dropouts To use the GMM select the Scope Multimeter icon from the home screen then select Graphing Multimeter from the menu See Tests and Capabilities Quick Reference on page 11 for a list o...

Page 18: ...hen performing diagnostics To use the lab scope select the Scope Multimeter icon from the home screen then select Lab Scope from the menu See Tests and Capabilities Quick Reference on page 11 for a list of available testing functions Specifications Function Range Accuracy Comments Signal Measurement Ch 1 yellow jack Ch 2 green jack Each channel input is referenced to common ground GND black jack S...

Page 19: ...nd continuity through a diode Scope supplied DC current is passed through the diode to measure the voltage drop between the two connected test leads Typical setup for positive to negative current flow positive lead anode side and negative cathode side a Frequency Measures the number of times a signal repeats itself per second Used to measure frequency of signals such as CKP CMP and wheel speed sen...

Page 20: ...erefore it does not need to be connected to the diagnostic tool ground jack 3 6 2 Channel 2 Lead The shielded green lead is used with channel 2 and is color matched with the channel 2 jack on the diagnostic tool This lead also includes a black right angle stackable ground plug Figure 3 2 Green Channel 2 lead a a 100 PSI Vacuum Used to measure vacuum up to 20 in Hg using the 0 100 psi transducer a ...

Page 21: ...gle stackable ground plug and a RCA type connector that is used to connect the lead to a secondary ignition adapter The spring clamp is used to connect to a ground Figure 3 4 Secondary Ignition Coil Adapter Lead and Clip on Wire Adapter NOTE Contact your sales representative for additional information on OEM specific CIC and COP secondary ignition adapters 3 6 5 Low Amp Current Probe optional The ...

Page 22: ...tional waveform demonstration tools are available as a training aid These demonstration tools generate common waveforms and allow you to vary their display characteristics by turning glitches on off helping you to become more familiar with the lab scope controls Common waveforms include AC sine wave variable frequency and pulse secondary ignition and more There are two tools currently available th...

Page 23: ...s on page 6 Icon Function Pause Pauses the data buffer Start Capture Resumes active data collection Control Panel a In full screen mode when selected this icon becomes surrounded by a white frame and opens the control panel at the bottom of the screen while switching active selection focus to the Show Hide or Probe icon in the Control Panel b In split screen mode control panel open when selected t...

Page 24: ...rrect an out of range condition by selecting a scale setting appropriate for the signal being sampled See Scale Vertical scale adjustment on page 19 for more information 3 8 Operation and Controls This section describes the general operation and controls used to configure the scope or meter to perform testing All three functions share similar control panel settings see Control Panel and Settings o...

Page 25: ...on process once completed zero ohms should be displayed when the leads are connected together When the leads are separated the upward arrows on the display indicate infinite resistance or an open circuit NOTE During an ohms test or a pressure test a manual probe recalibration can be initiated by selecting the probe icon from the Control Panel to open the probe menu Then select either the Ohms or P...

Page 26: ...nd settings Figure 3 13 Scale Sweep and Probe Settings The most common and typically the first adjustments made when performing tests are the setup or adjustment of the scales and selection of a probe All three of these adjustments are made from the control panel and are described in the following sections The following illustration is for reference and identifies key terms and features used thoug...

Page 27: ...ress the N X button to exit the menu The value displayed in the vertical scale icon indicates the active value Example Selecting 10V changes the vertical scale to a 10V volt scale The scale is always divided by 10 therefore each division is incremented by 1V Figure 3 15 Example Selecting 50 psi displays a 50 psi scale that is divided by 10 therefore each division is incremented by 5 psi Figure 3 1...

Page 28: ...Probe Probe type test selection Different types of Probes are available from the probe option menu depending on which type of test you are performing Changing the probe selection also changes the vertical scale to the applicable type of measurement To select a Probe type select the Probe icon to open the probe option menu then select a probe The probe icon will change to the selected probe Select ...

Page 29: ...ary ignition coil adapter EEDM506D Temperature optional Part number EEDM506D temperature adapter MT5030 Vacuum optional Part number EEDM5030 0 500 pressure adapter MT5030 Pressure 1 Show Hide Channel display on off turns channel on off 2 Trace Zero Baseline position adjustment adjusts zero baseline position 3 Probe Probe type test selection changes test probe function 4 Peak Detect maximizes sampl...

Page 30: ...etween the sample points saved to the data buffer memory To increase the chance of capturing a glitch with peak detect off a shorter time sweep should be selected Turing peak detect off avoids the need for an external filter to decrease the display of unwanted noise which can make diagnosis more difficult Example With a time sweep of 10 seconds on a screen 100 points wide the effective sample rate...

Page 31: ...t spikes by averaging the sampled data when filter is active For a calculated measurement test such as frequency pulse width dwell or duty cycle extremely fast spikes 20 µS and faster from sources like the ignition system are ignored when filter is active To turn the filter on and off select the Filter icon Invert The Invert feature is used to switch signal polarity so the trace appears upside dow...

Page 32: ... met for that channel in order to display all the other channels z To turn a trigger on off A trigger is activated by selecting the trigger icon from the control panel which then automatically initiates trigger slope setup 3 Select the desired channel s Trigger icon Each tap of the icon sets the trigger to a different slope setting or turns the trigger off 4 Select the desired slope setting to tur...

Page 33: ...form When this occurs the message Waiting for the trigger Figure 3 22 is displayed on the screen The trigger point can then be set to optimize viewing Manual Trigger when Manual Trigger is on if the signal does not cross the trigger point the screen will not update This allows you to capture intermittent events as the screen only updates when the signal meets your trigger selection NOTE When using...

Page 34: ...quency signal may not display if the vertical scale is set too high If the signal still seems incorrect use the lab scope to verify the signal integrity and signal spacing Slow or unequal spacing will display as a band or ragged signal depending on the sweep setting Refresh Selecting the Refresh icon Figure 3 24 clears the active trace s displayed and restarts the signal tracking from zero It also...

Page 35: ... the cursors providing you digital values of the cursor measurements See Cursor Measurements Panel on page 28 for additional information on the values displayed in the cursor measurements panel z To turn the cursors on off To turn the Cursors on display select the Cursor icon from the toolbar Two cursors are displayed on the test screen and the Refresh Min Live Max display panel is switched off an...

Page 36: ... by Delta The frequency value Hz shown is automatically calculated by the scope Example 1 Delta 20 46ms to get frequency divide 1 by 02046 1 02046 48 87Hz Example 2 Delta 2 53ms to get frequency divide 1 by 00253 1 00253 395 27Hz Use applicable decimal point placement during division as the Delta value changes 3 8 4 Secondary Ignition Testing The lab scope function can be used to display secondary...

Page 37: ...he black ground lead into the diagnostic tool test lead ground jack 2 Connect the yellow lead into the diagnostic tool test lead channel 1 jack 3 Connect the adapter lead ground clamp to vehicle ground If a jumper wire is used to extend the length of the adapter lead ground clamp lead keep it as short as possible 4 Connect the adapter lead RCA plug into the secondary ignition clip on or COP CIC co...

Page 38: ... screen 2 Select Settings Configure Scope Meter Display from the menu options 3 Select the desired option Show Grid turns grid lines on Hide Grid turns grid lines off 4 Select the Back icon or press the N X button to return to the Settings menu 3 9 2 Divisions The Divisions options allow you to change to your preference how the Vertical Scale Menu selections are represented and the type of value t...

Page 39: ...tical scale is divided into 10 major divisions and all scale adjustments reflect this factor of 10 The division set of 10 cannot be changed divisions cannot be added or removed Trace Full Scale changes the dropdown vertical scale menu selections to full scale mode which represents the selected unit of measurement over the entire full scale Example Figure 3 29 Selecting 10V changes the vertical sca...

Page 40: ... changes the value displayed in the Vertical Scale icon Display Full Scale displays the value of the entire full scale Example Figure 3 31 If the vertical scale is set to 1V the value displayed is 1V Figure 3 31 Display Per Division displays the graduation value of the major scale divisions Example Figure 3 32 If the vertical scale is set to 1V the value displayed is 0 1V Figure 3 32 ...

Page 41: ...llow room for the new data being stored The most recent data is always available for review when the scope is paused and can be reviewed using the toolbar controls As a visual aid a graphic Data Buffer Slider Figure 3 33 1 is located at the top of screen and indicates the position of the current displayed frame of data in relation to the entire buffer memory capacity Note In Review Mode the slider...

Page 42: ...nt Using peak detect can also help in avoiding aliasing if the sweep time is too great for the waveform being captured Using peak detect is not appropriate for every instance but when using longer sweep settings it can help increase the capture time by allowing you to capture more than you could without it and still capture dropouts and points of interest See Peak Detect on page 22 for more inform...

Page 43: ...ress or expand multiple screens of data to quickly find glitches or signal losses NOTE Control icon function is normal when using zoom with the following exception Forward 1 Frame Back 1 Frame control icons press once moves multiple frames relative to the set magnification level e g 2X setting moves 2 frames 16X setting moves 16 frames When the Zoom icon is selected Figure 3 36 the display default...

Page 44: ... displays onscreen The cursor is used to quickly mark and navigate to points of interest or glitch in a captured waveform NOTE To quickly identify a glitch in a pattern it may be easier to initially view the waveform at a higher magnification level e g 256X or Max to display the entire captured waveform find the area of interest and then lower the zoom level to 8X or 2X to review that area in deta...

Page 45: ... zoom level wider view to look for a glitch in the signal The following three illustrations show a generic square waveform to illustrate this method 1 Monitoring Capturing waveform as it displays normally Figure 3 40 You may not see a glitch while monitoring at this setting Figure 3 40 2 Pause data capture and then zoom out this example is at 256X to see more data and to possibly find a glitch Fig...

Page 46: ... details The saved file can be viewed by selecting Previous Vehicles and Data View Saved Data see View Saved Data on page 56 for additional information 3 13 General Reference 3 13 1 Basic Setup Tips unknown signal type When conducting automotive diagnostics situations may arise when you need to capture and analyze a signal that you are not familiar with or know what the intended waveform pattern s...

Page 47: ...ignal vertically on the screen to the desired position See Trace Zero Baseline position adjustment on page 22 If the signal cycles are compressed close to each other try and readjust the sweep scale horizontal scale to a lower setting to display less cycles Once you have a usable signal displayed if needed use the trigger function to stabilize a changing or erratic signal a signal that may flicker...

Page 48: ...ct the 1Search or Component Search tab Figure 3 44 4 Enter a search term e g MAF sensor 5 If SureTrack results are available select the link under the Probable Components header 6 From the SureTrack page select the Waveforms and PIDs link the link is active only if waveforms or PIDs are available Figure 3 44 NOTE Examples are not available for all vehicles or components and are supplied from vario...

Page 49: ...y Coupling AC blocks the DC portion of signal Threshold provides a more accurate measurement on select GMM tests where noise is present Scale Vertical scale adjustment adjusts vertical scale Using a higher setting may provide a cleaner signal in some situations For signals that do not display or display off the screen erratic compressed etc Use a trigger to help stabilize the signal Try and set th...

Page 50: ... 4911541 psi 1 inHg 3386 388 Pa Pressure Conversions psi x 0 0689 bar psi x 6 8950 kPa psi x 0 0703 kg cm bar x 14 5030 psi bar x 100 0000 kPa Electrical Units Symbol Description Equivalents bar x 29 5300 inHg 60 F kPa x 0 1450 psi kPa x 0 0100 bar kPa x 0 0102 kg cm kPa x 0 295299 inHg kg cm x 98 0700 psi kg cm x 0 9807 bar kg cm x 14 2200 kPa inHg 60 x 0 0333 bar inHg 60 x 3 3770 kPa inHg 60 x 0...

Page 51: ...gnals on time displayed on a 0 to 60 degree scale 0 0 30 50 60 100 Dwell 90 Measurement of the length of a signals on time displayed on a 0 to 90 degree scale 0 0 45 50 90 100 Filter Function used to filter or smooth out spikes and fast variations in signals Frequency The number of times a signal repeats in one second Measured in Hertz cycles per second Glitch An intermittent or unwanted error in ...

Page 52: ...h specific information is transmitted in an electronic circuit or system Square Wave A square or rectangular waveform digital which alternately switches high to low on off for specific lengths of time that has very fast rise and fall times Sweep Scale The horizontal scale on the grid Also referred to as time scale or x axis Threshold The threshold function automatically sets a trigger and determin...

Page 53: ...asses provides even more support by including non vehicle specific tests and resources that allow you to quickly perform common tests review basic reference information and more 4 1 Main Topic Links Training and Classes page 45 Power User Tests page 46 Screen Layout and Icons page 48 Operation page 49 Saving and Reviewing Data Files page 54 4 2 Training and Classes Training and Classes is a compan...

Page 54: ...rious types of pressures voltage and current Transducers are available as optional equipment A T Line Pressure and Shift Solenoid A T Line Pressure Test EGR Temperature Sensor and EGR Vacuum Exhaust Back Pressure Test Fuel Pressure and Fuel Pump Current Fuel Pressure and Fuel Pump Voltage Fuel Pressure Test How To Guide The How To option provides multiple topics and references ranging from instruc...

Page 55: ...rence Manual Using Fuse Box for Current Test Hard to Reach Wiring Features and Benefits Selecting Features and Benefits provides basic feature description and operational information about the diagnostic tool Additional information is provided for ShopStream Connect optional waveform demonstration boards and optional accessories Selections include 5 Minute Walk Thru With Demo Board provides instru...

Page 56: ...screen functionality is limited however you can adjust the zero baseline position 0 value of the signal on the horizontal scale by touching and dragging the zero baseline marker 4 3 2 Guided Component Tests Control Icons Guided Component Tests toolbar control icons may vary depending on the active function or test A yellow frame surrounding an icon highlighted indicates it is selected Other contro...

Page 57: ...nformation Exact procedures may vary by the make model and year of the vehicle z To identify a vehicle for testing 1 Select the Guided Component Tests icon on the Home screen 2 Select a vehicle type from the menu A list of manufacturers displays Figure 4 3 Figure 4 3 Manufacturer list 3 Select the vehicle manufacturer from the list A model year menu displays 4 Select the vehicle year from the menu...

Page 58: ...lable for testing displays Figure 4 5 Figure 4 5 Available systems menu 6 Select a system and a list of tests available for the identified vehicle displays 7 Select a test from the list to continue The identification sequence is now complete refer to the Operations section that follows for details on how to navigate through the Guided Component Tests information and perform tests z To select a sys...

Page 59: ...r pin location and functions and abbreviation reference 4 4 2 Component Information Component Information provides if available specific operational information on the selected component and may also include electrical connector and pin location and function details z To view component information 1 Select a component 2 Select Component Information from the Component Test menu Figure 4 8 Figure 4 ...

Page 60: ... Use the scroll bar to view additional information 3 Select Back on the Toolbar or press the N X button to return to the component menu 4 4 3 Tests Tests provides if available specific instructions to help you perform tests on components Selecting a component test opens a preconfigured meter to start the test and may also provide connection instructions specifications and testing tips z To select ...

Page 61: ...ay the information panel in full screen view Tap on it again to return to split view The Expand Collapse icon can also be used to toggle through split and full screen views Figure 4 13 Figure 4 13 View Options Some tests e g signature integrity tests may include waveforms examples within the information panel These waveform examples allow you to compare your test results for quick diagnosis Figure...

Page 62: ...l Panel icon from the toolbar to display the Control Panel Figure 4 15 For additional information on channel settings see Control Panel and Settings on page 17 Figure 4 15 Control Panel Channel Controls 4 4 4 Saving and Reviewing Data Files Save and Stop control icon operation and data review procedures are the same as used for the Scope Multimeter function see Saving and Reviewing Scope Multimete...

Page 63: ...e vehicle identification sequence when performing a retest after repairs have been made The oldest vehicle record is deleted when a new vehicle is identified once there are twenty five vehicles on file Figure 5 1 Vehicle history list z To select from the vehicle History 1 Select Previous Vehicles and Data from the Home screen 2 Select Vehicle History from the menu A list of up to 25 previously tes...

Page 64: ...ew a saved data file or image 1 Select Previous Vehicles and Data from the Home screen 2 Select View Saved Data from the menu 3 Select a file to review from the list 5 1 3 Delete Saved Data This menu option is used to permanently erase saved files from memory z To delete a saved file 1 Select Previous Vehicles and Data from the Home screen 2 Select Delete Saved Data from the menu A list of saved f...

Page 65: ...pe page 61 Backlight Time page 61 Touch Screen Calibration page 61 Time Zone page 62 Clock Settings page 62 Daylight Savings Time page 62 Time Format page 62 Date Format page 62 6 1 Tools Menu The following options are available from the Tools menu Connect to PC use to transfer and share files with a personal computer PC Configure Shortcut Button on page 58 use to change the function of the shortc...

Page 66: ...munications icon appears on the right edge of the title bar 2 Select Tools from the Home screen 3 Select Connect to PC from the Tools and Setup menu A screen message will display to confirm the tool is in Connect to PC mode Figure 6 2 6 1 2 Configure Shortcut Button This feature allows you to change the function of the Shortcut button Options are Brightness opens the brightness setting screen Save...

Page 67: ...tings Selecting System Settings opens a menu with two options Display and Date Time Either selection opens an additional menu Display options include Brightness on page 60 adjusts the intensity of the screen back lighting Color Theme on page 60 changes the background color of the screen display High Contrast Toolbar on page 60 enhances toolbar graphics for poor lighting conditions Font Type on pag...

Page 68: ...al when working under poor lighting conditions Selecting opens a menu with two choices Day Theme white background and Night Theme black background Make a selection and a please wait message momentarily displays followed by the Home screen The new toolbar setting is now active High Contrast Toolbar This option allows you to switch to a high contrast toolbar This toolbar features black and white ico...

Page 69: ...conds 30 Seconds 45 Seconds 60 Seconds Select the menu item desired or scroll and then press the Y a button to make a selection Select Back or Home on the toolbar to return to either the Settings menu or the Home screen Touch Screen Calibration Calibrating the touch screen maintains the accuracy of the touch sensitive display IMPORTANT To avoid serious damage to the Diagnostic Tool always complete...

Page 70: ...r 5 Select the check a icon on the screen or press the Y a button to move the highlight to the next field 6 Repeat Step 4 and Step 5 until the correct time is displayed 7 Select the Back icon on the toolbar or press the N X button to close the Clock Settings window and return to the Settings menu Daylight Savings Time This option opens a menu to configure the internal clock for Daylight Savings Ti...

Page 71: ... Settings on page 32 Configure Units Selecting opens a dialog box that allows you to choose between US customary or metric units of measure for temperature vehicle speed air pressure and other pressures Figure 6 9 Configure units menu z To change the units setup 1 Select Tools from the Home screen to open the menu 2 Select Configure Units to open the menu 3 Select an item from the Configure Units ...

Page 72: ...manuals Main Topic Links Using SSC Connecting to your PC page 64 SSC Main Screen page 65 Scanner DataViewer page 66 Image Viewer page 66 Printing the Code Scan Vehicle System Report page 67 Customizing the Code Scan Vehicle System Report page 68 Software Upgrades and Updates page 70 7 1 Using SSC Connecting to your PC z To connect and use SSC with your diagnostic tool 1 Download and install SSC on...

Page 73: ... editable 2 File directory structure displays the file directory structure of your PC in standard Windows format and shows any connected diagnostic tools at the bottom of the data list 3 Data Manager Toolbar provides control icons that perform a variety of operations on data files 4 Main Menu bar contains File Edit Tools and Help menus 5 Tabs provides access to data files and presets stored on the...

Page 74: ...eenshots saved on your diagnostic tool with your PC NOTE File extension types vary depending on the diagnostic tool Not all the file extensions described here may be available on your diagnostic tool Figure 7 4 1 Menu bar 2 Display toolbar 3 Graph display 4 Properties icon 5 Vertical Scroll bar 6 Zoom controls 7 Slider bar 8 Navigation toolbar 9 Parameter text list 10 Highlighted PIDs indicates gr...

Page 75: ...onnect 1 Double click the code scan XML file from the file list to open the Vehicle System Report Figure 7 5 in the Code Scan Viewer Figure 7 6 Figure 7 5 2 Select Print or Print Preview from the Code Scan Viewer menu to print or preview the Vehicle System Report Figure 7 6 Figure 7 6 Selecting Print opens the Windows print dialog window Figure 7 7 Select your printer from the list then select Pri...

Page 76: ...e scan XML file from the file list to open the Vehicle System Report Figure 7 8 in the Code Scan Viewer 2 Hover the cursor over the area shown in Figure 7 8 and select the desired option to add to the report header Figure 7 8 To edit the Shop Information header of the Vehicle System Report 1 From ShopStream Connect select Tools Options Edit Shop Info Figure 7 9 Figure 7 9 2 The Shop Info dialog bo...

Page 77: ...box to show the time the vehicle was scanned in the printout Figure 7 10 5 When you are finished editing select Save Figure 7 10 to save the information and close the dialog box To edit the VIN and License Plate fields and or add notes to the Vehicle System Report 1 From ShopStream Connect open the code scan XML file to be edited Figure 7 11 2 Click in the editable fields as shown in Figure 7 11 t...

Page 78: ... NOTE For additional information on ShopStream Connect software updates and upgrades download the ShopStream Connect User Manual from our website http diagnostics snapon com usermanuals 7 7 1 End User License Agreement Before software installation at initial purchase and before all subsequent software updates upgrades installations End User License Agreement EULA acceptance is required IMPORTANT U...

Page 79: ... EULA acceptance agreement screen Figure 7 14 Typical EULA acceptance screen To Decline at the screen prompt Figure 7 14 select I Decline A confirmation message is displayed providing options to Go Back or Exit the software installation Figure 7 15 Figure 7 15 Typical EULA acceptance screen ...

Page 80: ...ctors clean with a damp cloth IMPORTANT Do not use any abrasive cleansers or automotive chemicals on the diagnostic tool 8 1 1 Cleaning the Touch Screen The touch screen can be cleaned with a soft cloth and a mild window cleaner IMPORTANT Do not use any abrasive cleansers or automotive chemicals on the touch screen 8 2 Battery Pack Service 8 2 1 Safety Follow all safety guidelines when handling th...

Page 81: ...cessary it should be stored in a in a cool dry well ventilated place with a 30 to 75 percent state of charge to prevent loss of characteristics To prolong the life of your battery turn off the diagnostic tool when not in use The diagnostic tool has a built in charger that recharges the battery on demand whenever it is connected to a power source 8 2 2 Ordering a New Battery Pack If the battery pac...

Page 82: ...cycling facility in accordance with local national and international regulations IMPORTANT Always dispose of materials according to local regulations For additional information within the United States of America contact Rechargeable Battery Recycling Corporation RBRC at www call2recycle org Phone 800 822 8837 For additional information within Canada contact Rechargeable Battery Recycling Corporat...

Page 83: ...agent Product Training Videos Diagnostic tool specific training videos are available on our website Follow along and learn the basics of diagnostic tool operation with our free training videos Videos are product specific and are available at http diagnostics snapon com Click on the Training Support tab select the applicable diagnostic tool then select See Training NOTE Sample titles are listed bel...

Page 84: ...Tips Videos examples Air Fuel Ratio Sensor Test Fuel Injector Voltage and Current Tests Scope Alternator Ripple Test Scope Fuel Pump Current Ramp Test Scope BMW Rain Sensor Calibration Harley Davidson ABS Brake Bleed CAN Bus Diagnostics Scope Harley Davidson Functional Tests Chevrolet Volt Coolant Pump Bleed Harley Davidson Key Fob Programming Chrysler HVAC Test Hyundai Blind Spot Detection System...

Page 85: ... The Power of Troubleshooter Tips Scanner Ford 6 7L Transmission Solenoid Characterization Top Level Menus Built In Scope Training Ford Diesel Injector Coding Toyota EVAP Test VW Audi Flexible Service Reset Scanner Toyota Multiple Freeze Frame Scanner Toyota Transmission Compensation Coding Snap on Training Solutions Diagnostic Quick Tips Videos examples ...

Page 86: ...within this manual may not be applicable to other diagnostic software versions Disclaimer of Warranties and Limitation of Liabilities All pictures and illustrations shown are for reference purposes only All information specifications and illustrations in this manual are based on the latest information available at the time of printing and are subject to change without notice While the authors have...

Reviews: