


55 |
P a g e
R e v 5 - 1 9
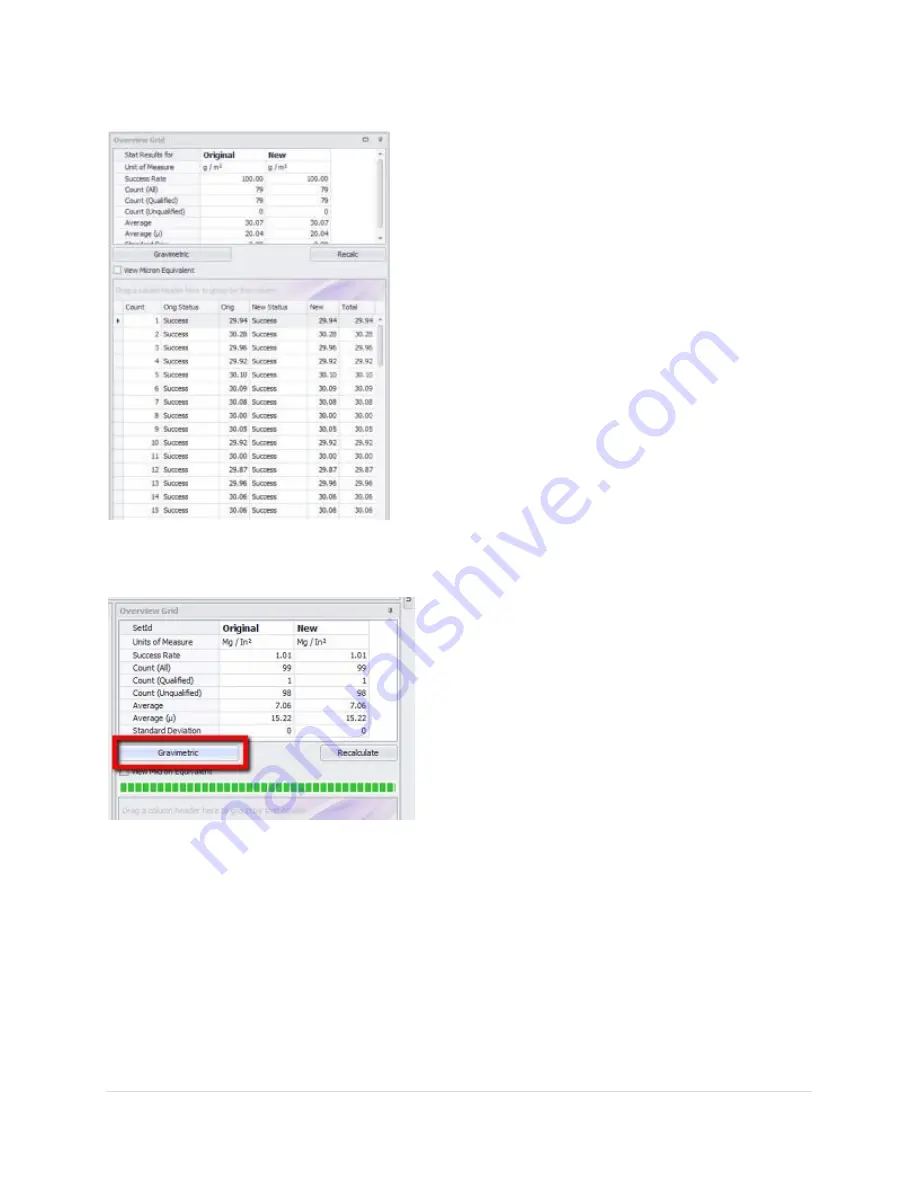
Overview Grid
Once a recipe has been changed, you can see the impact
across all the analysis readings to determine if the change
has improved the reading success or decreased the
success rate. You can see the reading success rate for the
original result set as it was performed during the
measurement run, and next to it you can see the new
results (New Status). You can still select which Probe or
Layer you wish to analyze, keeping in mind that only the
probes with analysis data will reflect results.
You can also click and drag column headers to group by
those columns as indicated in the figure above.
This helps to group together bad readings to better
investigate them.
NOTE:
the value with (µ) next to it is the micron
thickness that is calculated. If the conversion has been
applied, then the conversion value will be displayed in
the adjacent column.
Above the results grid, you will see what the determined success rates are, along with Average
microns for this set of data and the average of the calculated units (displayed under “Average”).
Gravimetric
When the Gravimetric Assistant is invoked from the
Analysis tool, the values for measuring are already
added in providing the “Debug” checkbox was
checked during the run. Otherwise, you will need to
use the Gravimetric tool from within the Recipe Editor
and enter the Average Microns measured by the
SpecMetrix® system for the Gravimetric sample.
When used here the “…in microns” value is provided
from the Original Average Microns calculation and
cannot be altered from this function.