


38 |
P a g e
R e v 5 - 1 9
Adjustable Target Set
6.
Stop
: Stops measuring of the active probe on
that line/tab.
7.
Stop All
: Stops measuring on all active lines.
Note
: During measuring, users can click on the
probe name to isolate that probe.
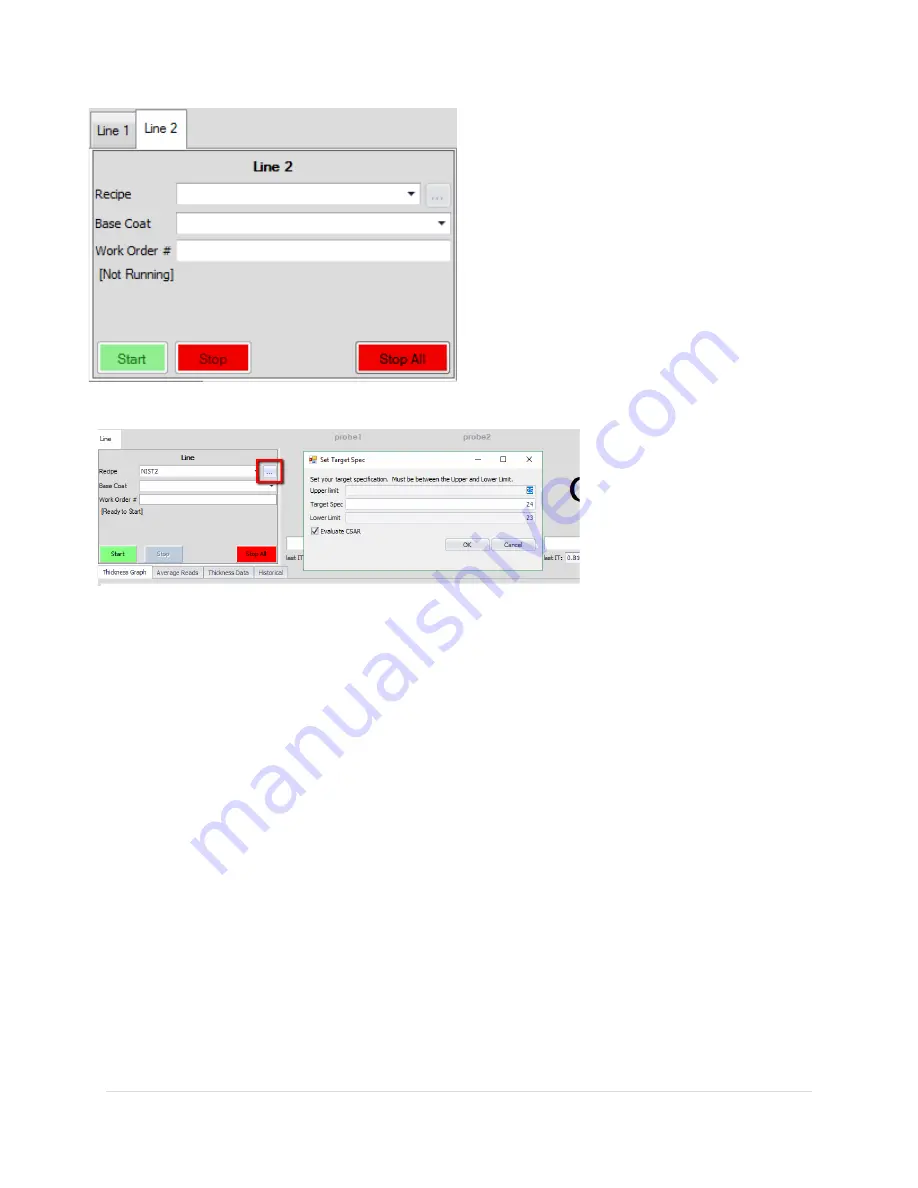
In the image below, the […]
(ellipsis) button to the right of
the Recipe gets enabled when
the selected recipe qualifies as
an Adjustable Target Recipe.
When the ellipsis button is
clicked, a popup window is
displayed showing the recipe
defined Upper Limit and Lower Limit (These are not adjustable), as well the current Target Spec is
displayed and is adjustable within the range of “Greater than” but not equal to Lower Limit, and “Less
than” but not equal to Upper Limit. When you click the “OK” button, the graph will recalculate the SPC
bars as seen below. The original graph on Right side (small image), the new graph on the left (shown in
In-line).
Not all recipes qualify as Adjustable Target Spec recipes. The recipe must be a ‘simple’ single layer
recipe, not defined as basecoat or subtractive, and cannot be set if used in a differential system.
Statistics Tab
The Statistics tab is dynamic, and if the system uses fixed probes, then each probe will be displayed with
the Probe Name listed instead of Lane # for the respective “Line.” For traversing, each Lane will have its
own column of data. Likewise, if there is a lane definition selected the Line will adjust its Lane count
accordingly. As seen below the “Top” line is defaulted with ten lanes, and the “Bottom” line has a lane
definition selected which overrides the default 10 (with a lesser number of lanes), in this case to 5 lanes.
Distance to Target
The Distance to Target value takes the “Target Spec” from the recipe, or adjusted target spec if
overridden, and provides a relative thickness (or weight) to target.