40
SANTERNO
USER MANUAL
1
.
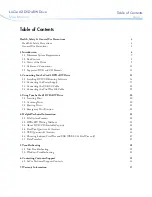
Running frequency pu value: blue -
;vertical axial range: [-1.2,1.2]
2.Output current pu value: red -
; vertical axial range: [-1.2,1.2]
3.Output voltage pu value: yellow -
; vertical axial range: [-1.2,1.2]
5.2.2 Trend Curve
Real time curve:
Trend curve supports real time curve and history curve. Actual time curve uses 5Hz frequency to take data sample
to make curve and the time axial max. length is 5 minutes. There are three kinds of curve in the real time curve:
running frequency pu value (running frequency/max. frequency), output current pu value (output current/VFD
rated output current) and output voltage pu value (output voltage/VFD rated output voltage). The current value of
those three parameters use different colors to show, each curve’s characteristic as following:
Figure 5-3 Trend curve – real time curve
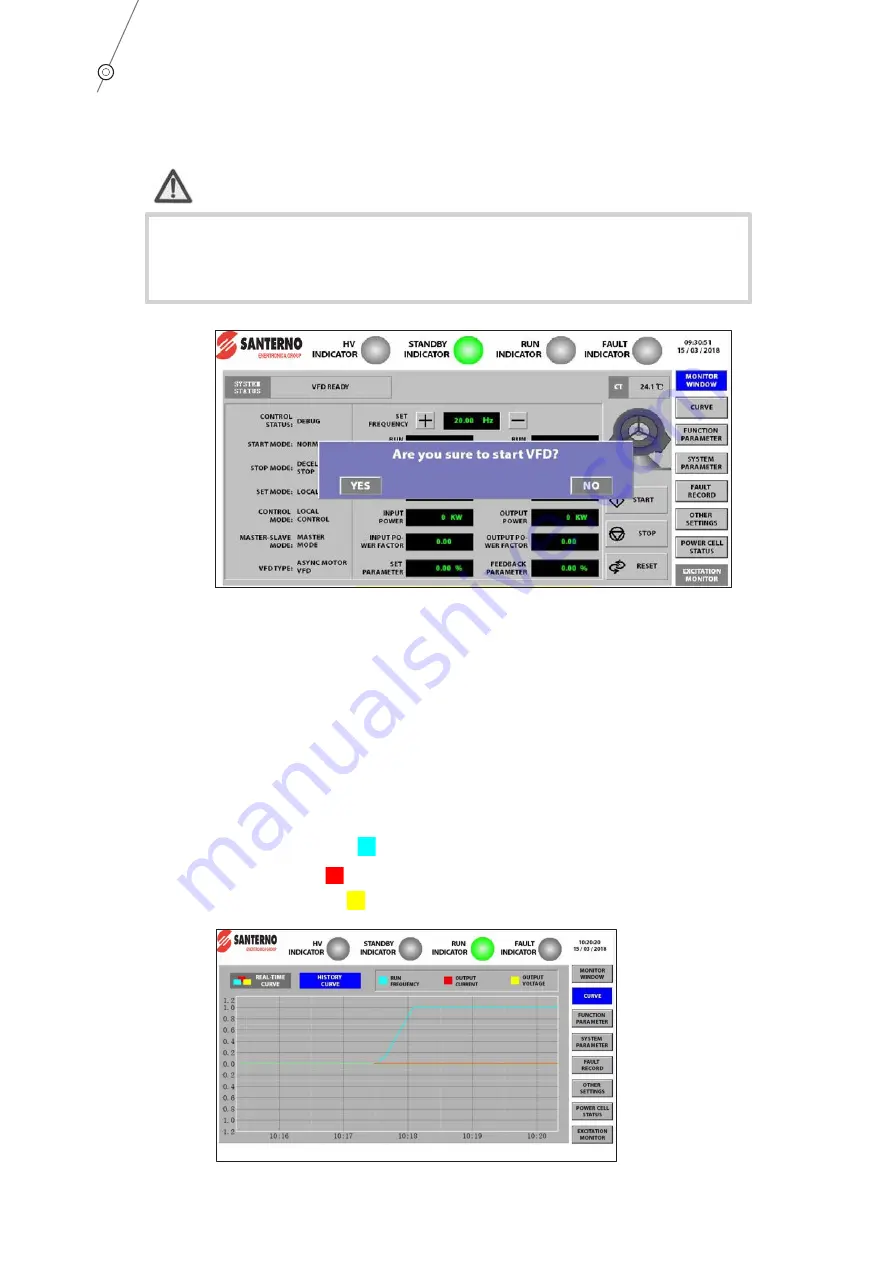
After pushing the start key, the touch screen will appear the window as Figure 5-2. Then if
you push the “Y” key, this window disappears and starts the VFD; if you push the “N” key, this
window disappears and stays earlier status.
Attention!
Figure 5-2 VFD start confirmation window


