Managing Tables
121
FS6300 NMS Administrator’s Reference Guide
8 • Monitoring SNMP Devices
Viewing and Graphing Table Data
You may view detailed information about specific table data in the SNMP Table window. To view more details
about an individual column, right-click on the
Column Header
and select
View Column Node Details
. You
may also select another column from the drop-down menu in the
Mib Description
window to view descrip-
tion details.
To create a graph of table details, select the entire row(s) and click
Graph
.
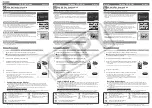
Figure 100. SNMP Table Graph
Move your cursor over the graph to view data values. You may modify the graph settings:
•
Polling Interval:
Specify the time interval between each retrieval of data. Default =
5 seconds
•
Average over Interval:
By default, the graph shows the values of the specified OID for different hosts for the
given polling interval. Select this option to plot the average of the values at a given polling interval.
•
X-axis Scale:
Specify the time value (in seconds) for the X-axis. You must enable the
Show Polled Values
option to modify the
X-axis Scale
. Default =
300 seconds
•
Show Absolute Time:
Select this option to show time values in the graph as hours:secs.
•
Max Poll Duration (secs):
Specify the time period to show all polled values for that time. You must enable
the
Show Polled Values
option to modify the
Max Poll Duration
.
•
Show Polled Values:
Enable this option to display all polled values for a specific time period, and to enable
other graph options. Default =
Disabled
•
Log Filename:
Specify the name for the log file. *
You cannot create a log file from a graph when the Mib
Manager is running as an applet because of security restrictions.
*
•
Log Polled Values:
Enable logging for polled values. *
You cannot enable this option when the Mib Manager
is running as an applet because of security restrictions.
*
•
Show Absolute Counters:
Enable this option to plot all absolute values.
•
Disable Error Dialog:
Enable this option to hide error messages when requests time out.