


52
optics11.com
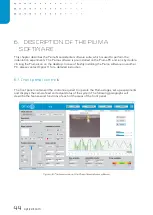
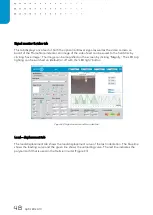
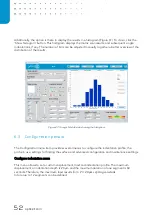
Additionally, the option is there to display the results in a histogram (Figure 47). To do so, click the
‘Show histogram’ button. This histogram displays the matrix scan results, and subsequent sin
gle
indentations, if any. The number of bins can be adjusted manually to gather a better overview of the
distribution of the results.
Figure 47: Young's Modulus tab showing the histogram.
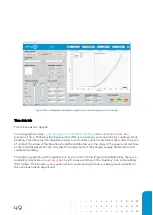
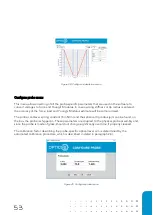
6.3
Configuration panels
The Configuration menu item provides several menus to configure the indentation profile, the
probe in use, settings for finding the surface and advanced configuration and maintenance settings.
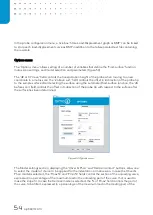
Configure indentation menu
This menu allows to set a custom displacement, load and indentation profile. The maximum
displacement or indentation depth is 20 µm and the maximum duration of one segment is 60
seconds. Therefore, the maximum load results from:
𝑃 = 20µ𝑚 ∗ 𝑠𝑝𝑟𝑖𝑛𝑔 𝑐𝑜𝑛𝑠𝑡𝑎𝑛𝑡
In total up to 12 segments can be defined.
Summary of Contents for CHIARO NANOINDENTER
Page 1: ...PIUMA NANOINDENTER USER MANUAL ...
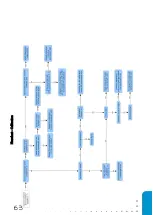
Page 63: ...63 Flowchart Calibration ...
Page 65: ......