


49
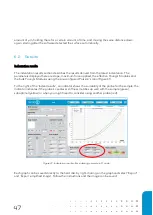
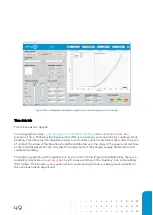
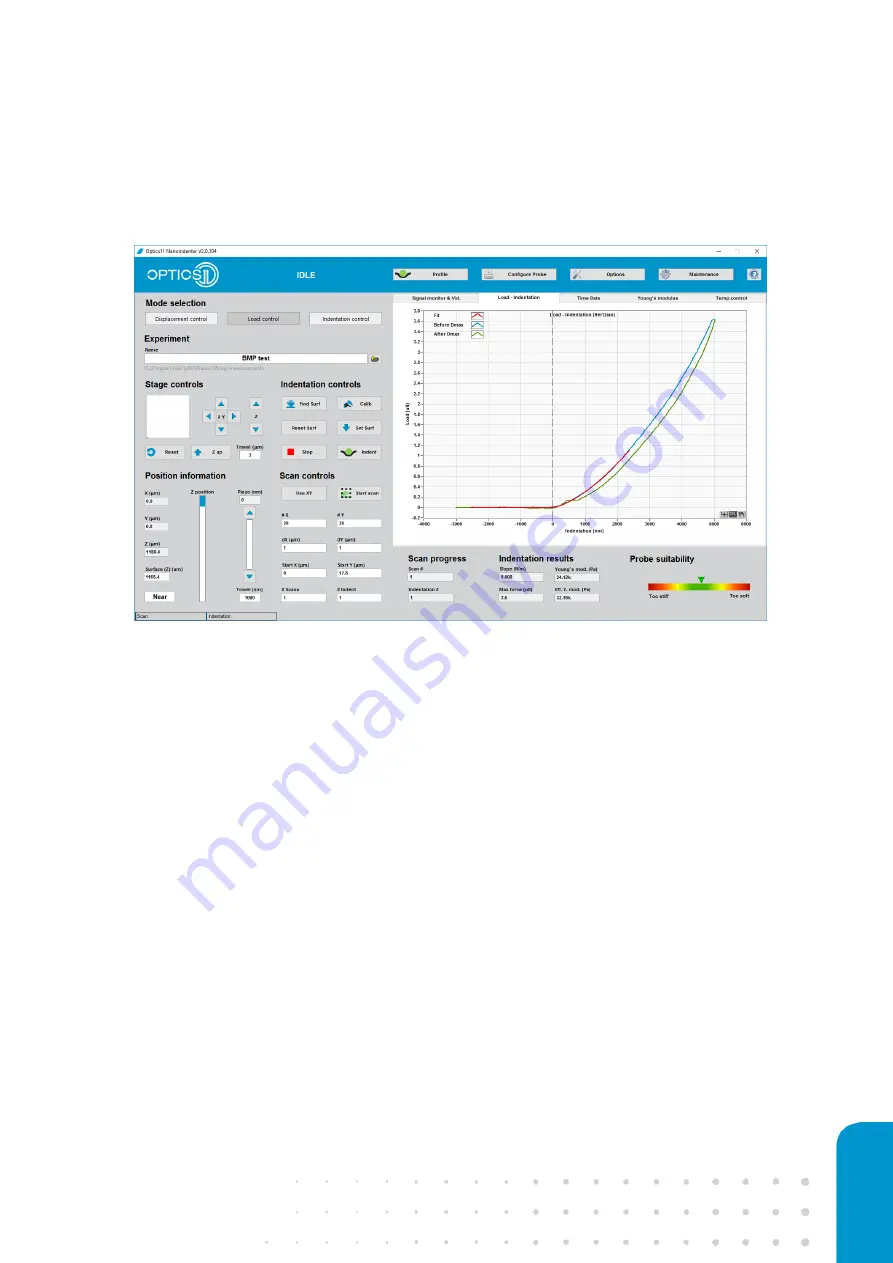
Figure 43: Load-displacement tab showing load- and unloading curve in P-mode.
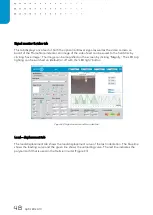
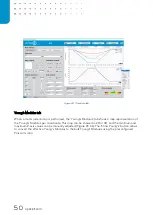
Time data tab
This tab shows two graphs:
The top graph contains
probe displacement
,
cantilever bending
and
indentation depth
as a
function of time. Following the displacement (Piezo) curve down, at some point the cantilever starts
bending. This indicates the indentation starts out of contact, which is preferred. Also, after the point
of contact, the slope of the blue line should be distributed over the slope of the green and red lines
as the initial displacement can only result in an approach of the sample, sample deformation and
cantilever bending.
The bottom graph shows the applied
load
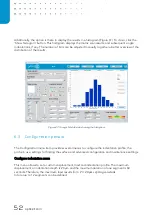
as a function of time (Figure 44). Additionally, there is a
possibility to activate an
auxiliary graph
by left-mouse-
clicking on the ‘Auxiliary’ icon and enabling
‘Plot visible’. This function is very useful when an external signal source is being used in parallel to
the nanoindentation experiment.
Summary of Contents for CHIARO NANOINDENTER
Page 1: ...PIUMA NANOINDENTER USER MANUAL ...
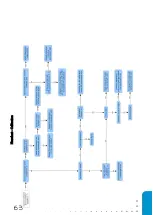
Page 63: ...63 Flowchart Calibration ...
Page 65: ......