


30
optics11.com
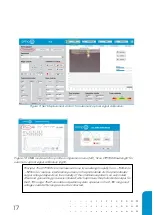
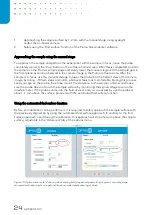
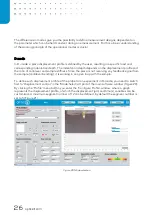
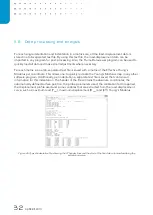
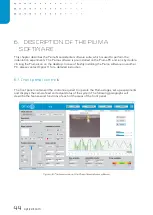
Figure 24: Piuma main software window while performing an experiment with single- or matrix indentations after pressing
the ‘Indent’
-
(red) or ‘Start scan’ button (green), respectively.
Single indentations
The configured displacement, load or indentation profile is executed by pressing the
‘
Indent
’
button in the home screen of the Piuma software (Figure 24). The Piezo movement can be tracked
by looking at the Piezo displacement bar, and the total progress is also displayed in the progress
bar. Directly after the indentation,
the results are displayed in the ‘Load
-
indentation’ tab and the
‘Time data’ tab.
An estimate of the Young’s Modulus (both effective and bulk), based on the chosen
model, is provided in the bottom of the screen.
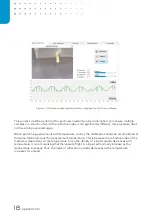
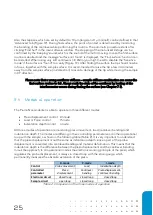
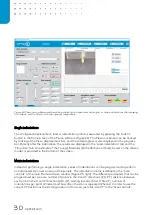
Matrix indentations
Instead of performing a single indentation, series of indentations can be programmed to perform
an automated scan over an area of the sample. The indentation matrix is defined in the
‘
Scan
controls’ of the main
Piuma software window (Figure 25, right). The different parameters that can be
programmed per scan are number of points in the X and Y directions (# X, # Y), distance between
each point in the X and Y directions (dX, dY), starting location (Start X, Start Y), number of
indentations per point (# Indent) and how often the scan is repeated (# Scans). In order to use the
current XY position as the starting position of the scan, just click ‘Use XY’ in the ‘Scan controls’.
Summary of Contents for CHIARO NANOINDENTER
Page 1: ...PIUMA NANOINDENTER USER MANUAL ...
Page 63: ...63 Flowchart Calibration ...
Page 65: ......