


47
amount of µm, holding there for a certain amount of time, and moving the same distance down
again, starting after the software detected the surface automatically.
6.2
Results
Indentation results
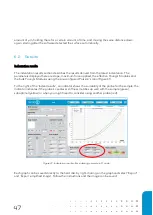
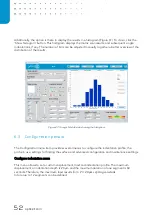
The indentation results section describes the results derived from the latest indentation. The
parameters displayed here are slope, maximum force applied, the effective Young’s Modulus and
the bulk Young’s Modulus using the pre
-
configured Poisson’s
ratio (Figure 41).
To the right of the ‘Indent results’, an indicator shows the suitability of the probe for the sample: the
indicator indicates if the probe’s cantilever stiffness matches up well with the sample (green),
suboptimal (yellow) or when you might need to consider using another probe (red).
Figure 41: Indentation results after indenting a sample in D-mode.
Each graph can be saved directly to the hard disc by right-
clicking on the graph and select ‘Export’
and ‘Export simplified image’. Fo
llow the instructions and the image can be saved.
Summary of Contents for CHIARO NANOINDENTER
Page 1: ...PIUMA NANOINDENTER USER MANUAL ...
Page 63: ...63 Flowchart Calibration ...
Page 65: ......