SAMM
User Manual
39
5.5.4 The Charts Tab
The Charts tab is the default tab displayed (Figure 33).
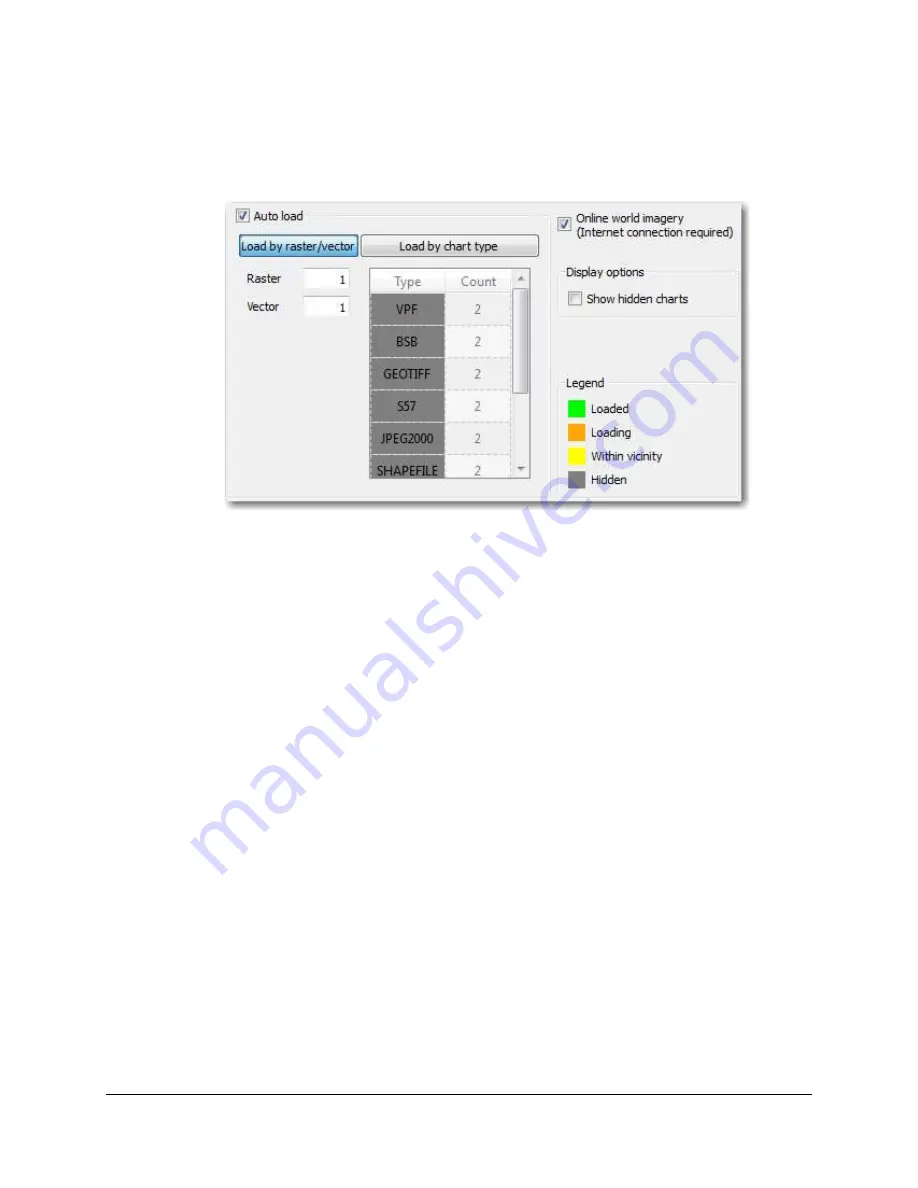
Figure 33. Charts Tab
By default, the
Auto load
and
Online world imagery
checkboxes are checked. Uncheck them
to disable the features. The auto load feature loads the files from the chart database that most
closely match the resolution (raster) or coverage (vector) of the mosaic window extent into the
mosaic window. It constantly looks for charts that satisfy its criteria, set in the
Load by
raster/vector
and
Load by chart type
fields.
The load by raster/vector feature loads charts up to the number entered per type of data
file (raster or vector). Click in the
Raster
or
Vector
fields and enter a number to change
the numbers.
The load by chart type feature loads charts of the specific format up to the number per
format (VPF for DNC, S-57 for ENC, BSB for RNC, GeoTIFF, shapefile, etc.). Formats
are listed in the Type column as they are loaded to the chart database.
The list doesn't
forget any file types loaded in all of SAMM's history, so it may present file types that are
not present in the database anymore. This happens when you unload the source folder.
Click in the types fields to enter the number per file type that the auto loader should load.
Toggle between the method that the auto load algorithm uses to load charts by clicking on the
buttons. The auto loader indicates which method is in use by highlighting the button in blue.
The display options and legend refer to the database table.
The
Show hidden charts
box unhides files hidden from the table. It does not unhide
them from the auto load algorithm. To do this, you must right-click on the chart and click
Unhide
.
5.5.4.1 Color Coding
SAMM color codes the charts in the database so that you can see what charts will be rendered
and what charts might be available for rendering. The legend is shown on the Charts tab, but
the color coding is used on all tabs of the advanced interface. Only the green, loaded charts
display in the basic interface.