48
Chapter 9
Multispectrum measurements
49
Norsonic Nor118
User Guide
To see the level vs. time (the profile) graph of another
frequency band:
1
Make sure the display shows a time profile (level vs.
time). Use the f
↔
t key, if needed.
2
Use the
↑
and the
↓
keys (repeatedly, if needed) to
move to another frequency band.
To see the global values:
1
Make sure the instrument is in global mode (a
Σ
dis-
played in the upper left corner of the display). If not,
press the
Σ↔∆
key to enter global mode.
2
Use the f
↔
t key to go between the sound level meter
display and the spectrum display. Move the spectrum
cursor as explained above.
e spectrum you see now is the global spectrum. is
spectrum should not be confused with the multispectrum
feature.
The result tables
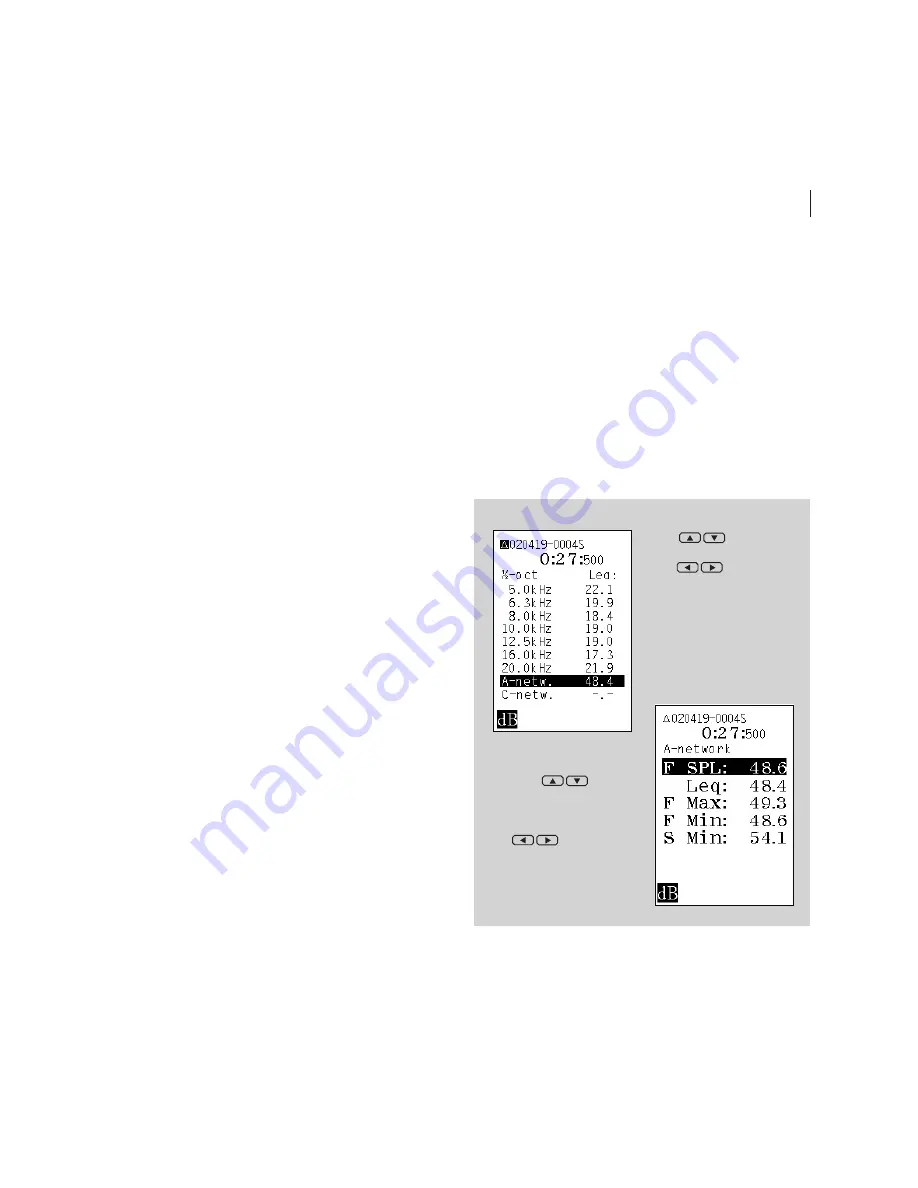
e measured values can be presented tabulated as usual.
In multispectrum mode there are two tables available in
profile mode:
• Each function shown for all frequency bands (use the
key to go to another function)
• e functions measured shown for a single frequency
band or spectral weighting network.
ese are shown in the Fig. to the right as well as over-
leaf together with the displays and tables available for the
global part of the measurement.
To produce the result tables in multispectrum mode:
1
Press once to produce Table 1 and again to produce
Table 2.
2
Press again to return to graphical display.
e key pressing sequence is also illustrated in the Fig.
overleaf, while operating details are provided below.
Use
keys to
move up and down in ta-
ble,
keys to move
to another moment in time
and
FUNC
to scroll through
the functions measured.
Table 1
Table 2
Use
keys to
move up and down in
frequency (incl. spectral
weighting networks) and
keys to move
to another moment in
time and
FUNC
to scroll
through the functions
measured.
Summary of Contents for nor118
Page 2: ......
Page 3: ...nor118 REAL TIME ANALYSER ...
Page 13: ...nor118 REAL TIME ANALYSER ...
Page 114: ......
Page 115: ......


