


PTP 250 User Guide
Managing performance
phn-2182_002v000
May 2011
7-21
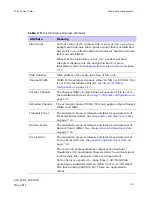
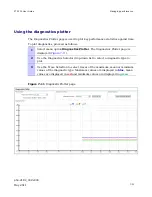
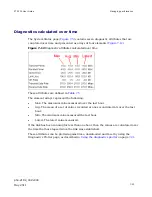
Using the diagnostics plotter
The Diagnostics Plotter page is used to plot key performance statistics against time.
To plot diagnostics, proceed as follows:
1
Select menu option
Diagnostics Plotter
. The Diagnostics Plotter page is
displayed (
Figure 7-11
).
2
Use the Diagnostics Selector drop-down list to select a diagnostic type to
plot.
3
Use the Trace Selection to select traces of the maximum, mean or minimum
values of the diagnostic type. Maximum values are displayed in
blue
, mean
values are displayed in
red
and minimum values are displayed in
green
.
Figure 7-11
Diagnostic Plotter page
Summary of Contents for Motorola PTP 250
Page 20: ...List of Tables phn 2182_002v000 xiv May 2011 ...
Page 30: ......
Page 80: ...Data network planning Chapter 2 Planning considerations phn 2182_002v000 2 22 May 2011 ...
Page 126: ...Notifications Chapter 4 Reference information phn 2182_002v000 4 36 May 2011 ...
Page 234: ...Testing the radio link Chapter 8 Troubleshooting phn 2182_002v000 8 14 May 2011 ...