


ODiSI 6
ODiSI 6
User’s Guide
Page 40
menus. As with the Gages, the Segment name can be edited within the Segment table by
clicking on it.
Segments can also be deleted by selecting the desired Segment in the Segment table and
then clicking the trash can icon in the upper right corner of the Segment table.
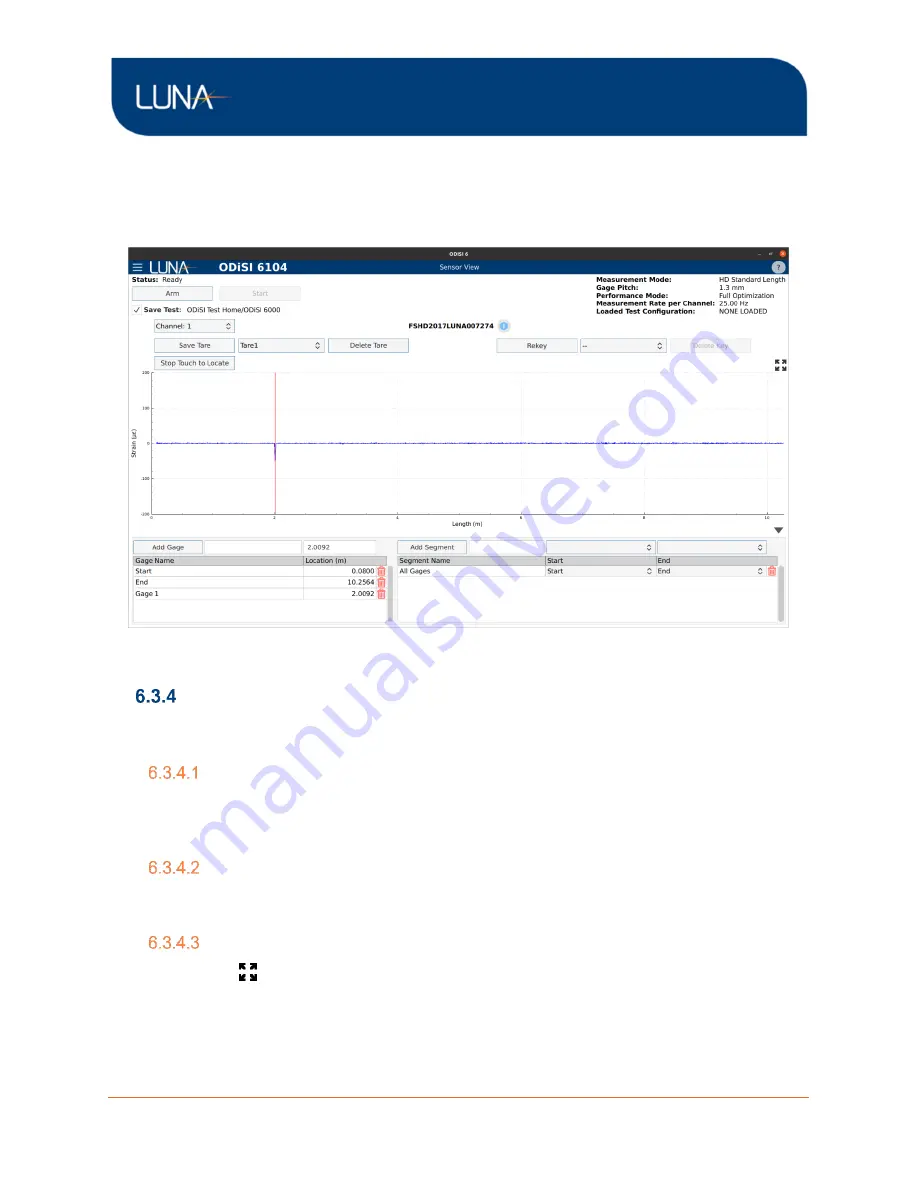
Figure 6-10: Gages and Segments
Plot Navigation
The ODiSI 6 software uses plots and graphs to display measurement data. The X and Y axes
of these plots can be rescaled to better view features in the measurement data.
Unconstrained Zoom In/Out
To zoom in on data in both X and Y, move the mouse cursor to the region of interest and use
the scroll wheel to zoom in or out. If using a laptop touch pad, use two fingers to swipe up or
down to change the zoom level.
X/Y-Axis Constrained Zoom
To zoom in on only one axis, click on the desired axis (this highlights it in blue) and use the
mouse wheel or two-finger scroll to zoom in or out.
Fit Plot
The Fit Plot
button automatically zooms in or out to fit all the data present in the plot.
Note:
No data is being saved or streamed when viewing and evaluating the sensors.


