STRM Users Guide
Network Surveillance
17
Note:
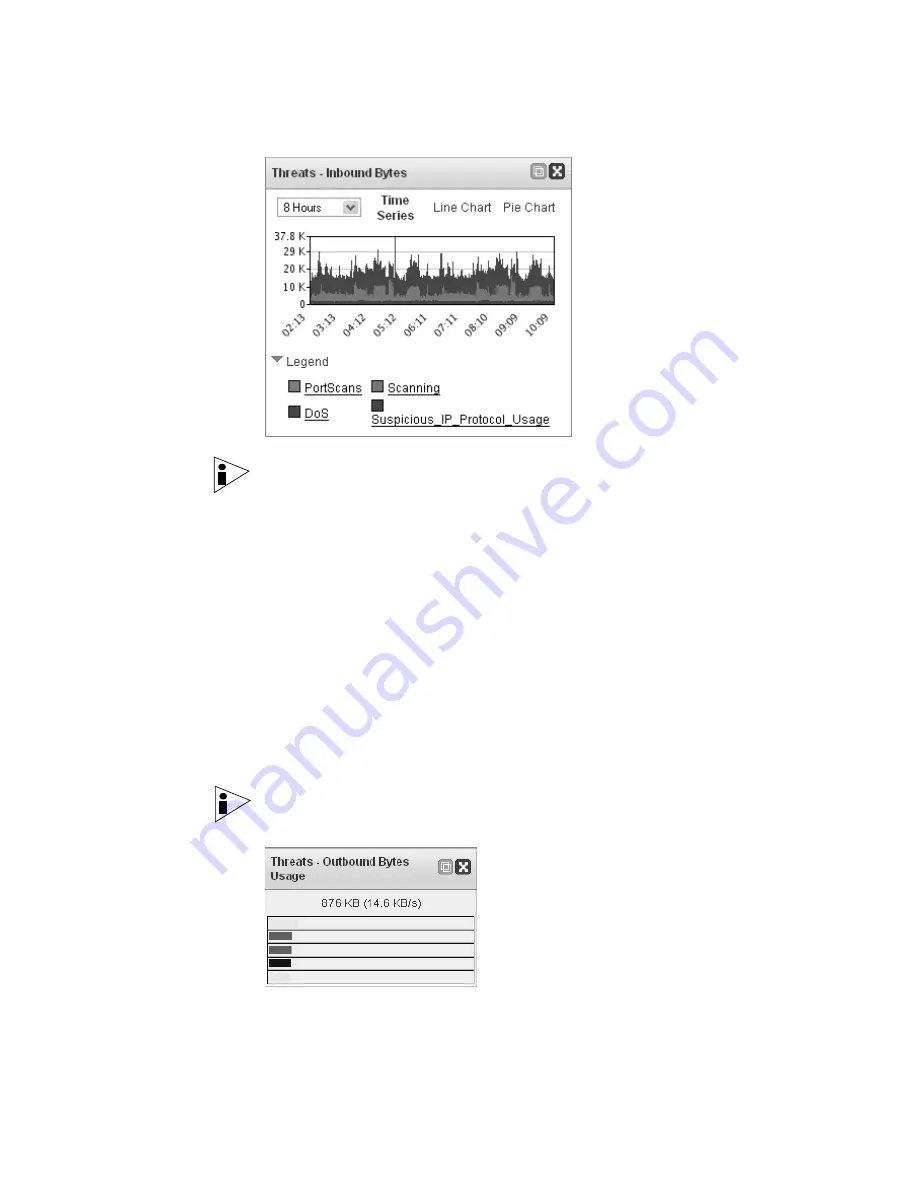
You can click any area of the graph, or click the dynamic legend to
immediately access the Network Surveillance interface.
To customize your Threats display:
•
Period of Time
- Using the drop-down list box, select the period of time you
wish the Dashboard graph to display.
•
Chart Type
- You can display the data using a Time Series (default), Line
Chart, or Pie Chart. To change the chart type, click
Time Series
,
Line Chart
or
Pie Chart
at the top of the graph.
TopN
TopN data displays the most active objects from the top of your network providing
you with information from the most active network objects. Active objects can
include threats, applications, protocols, etc. The active object appears as a bar
chart and displays the highest level of activity by the number of assets, bytes,
packets, active ports, and number of flows. This is determined by the current view
displayed on the STRM graphs.
Note:
You can double-click the bars to immediately navigate to the Network
Surveillance interface and display the traffic on the STRM graphs.
Summary of Contents for SECURITY THREAT RESPONSE MANAGER 2008.2 R2 - LOG MANAGEMENT ADMINISTRATION GUIDE REV 1
Page 13: ...STRM Users Guide Assets 7 Note For more information see Chapter 8 Managing Assets...
Page 100: ...STRM Users Guide 94 INVESTIGATING OFFENSES...
Page 138: ......
Page 226: ......


