Pedal-Based Power
Vector measures pedal-based power.
Vector measures the force you apply a few hundred times every
second. Vector also measures your cadence or rotational
pedaling speed. By measuring the force, the direction of force,
the rotation of the crank arm, and time, Vector can determine
power (watts). Because Vector independently measures left and
right leg power, it reports your left-right power balance.
NOTE:
The Vector S system does not provide left-right power
balance.
Cycling Dynamics
Cycling dynamics metrics measure how you apply power
throughout the pedal stroke, and where you apply power on the
pedal, allowing you to understand your particular way of riding.
Understanding how and where you produce power allows you to
train more efficiently and evaluate your bike fit.
Using Cycling Dynamics
Before you can use cycling dynamics, you must pair the Vector
power meter with your device (
).
NOTE:
Recording cycling dynamics uses additional device
memory.
1
Go for a ride.
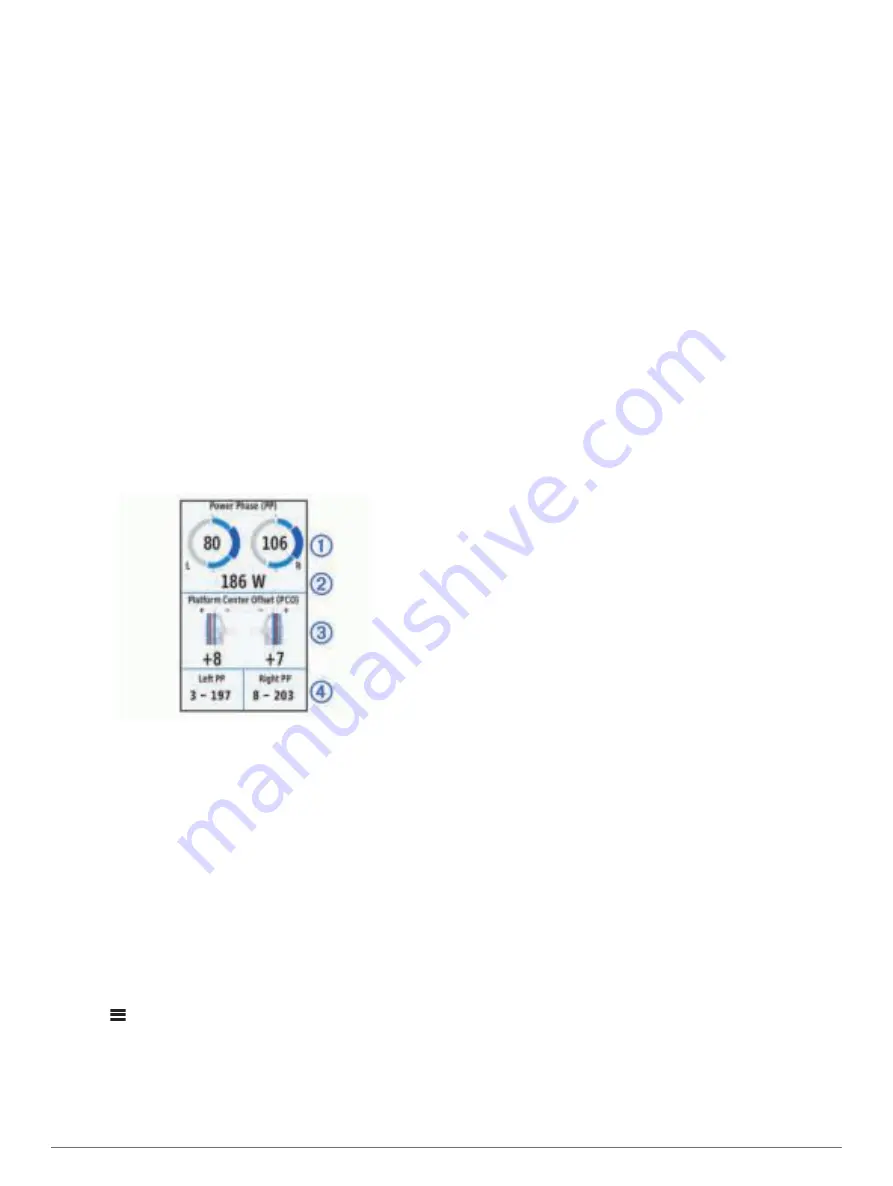
2
Scroll to the cycling dynamics screen to view your peak
power phase
À
, total power phase
Á
, and platform center
offset
Â
.
3
If necessary, hold a data field
Ã
to change it (
).
NOTE:
The two data fields at the bottom of the screen can be
customized.
You can send the ride to your Garmin Connect account to view
additional cycling dynamics data (
).
Power Phase Data
Power phase is the pedal stroke region (between the start crank
angle and the end crank angle) where you produce positive
power.
Platform Center Offset
Platform center offset is the location on the pedal platform where
you apply force.
Customizing Vector Features
Before you can customize Vector features, you must pair a
Vector power meter with your device.
1
Select >
Sensors
.
2
Select the Vector power meter.
3
Select
Sensor Details
>
Vector Features
.
4
Select an option.
5
If necessary, select the toggle switches to turn on or off
torque efficiency, pedal smoothness, and cycling dynamics.
Updating the Vector Software Using the Edge Device
Before you can update the software, you must pair your Edge
device with your Vector system.
1
Send your ride data to your Garmin Connect account
(
Sending Your Ride to Garmin Connect
).
Garmin Connect automatically looks for software updates
and sends them to your Edge device.
2
Bring your Edge device within range (3 m) of the sensor.
3
Rotate the crank arm a few times. The Edge device prompts
you to install all pending software updates.
4
Follow the on-screen instructions.
Using Electronic Shifters
Before you can use compatible electronic shifters, such as
Shimano
®
Di2
™
shifters, you must pair them with your device
(
). You can customize
the optional data fields (
). The
Edge 1030 device displays current adjustment values when the
sensor is in adjustment mode.
Situational Awareness
Your Edge device can be used with the Varia Vision
™
device,
Varia
™
smart bike lights, and rearview radar to improve
situational awareness. See the owner's manual for your Varia
device for more information.
NOTE:
You may need to update the Edge software before
pairing Varia devices (
Updating the Software Using Garmin
).
History
History includes time, distance, calories, speed, lap data,
elevation, and optional ANT+ sensor information.
NOTE:
History is not recorded while the timer is stopped or
paused.
When the device memory is full, a message appears. The
device does not automatically delete or overwrite your history.
Upload your history to Garmin Connect periodically to keep track
of all your ride data.
Viewing Your Ride
1
Select
History
>
Rides
.
2
Select a ride.
3
Select an option.
Viewing Your Time in Each Training Zone
Before you can view your time in each training zone, you must
pair your device with a compatible heart rate monitor or power
meter, complete an activity, and save the activity.
Viewing your time in each heart rate and power zone can help
you adjust your training intensity. You can adjust your power
zones (
) and your heart rate
zones (
) to match your
goals and abilities. You can customize a data field to display
your time in training zones during your ride (
).
1
Select
History
>
Rides
.
2
Select a ride.
3
Select an option:
• If your ride has data from one sensor, select
Time in HR
Zone
or
Time in Power Zone
.
• If your ride has data from both sensors, select
Time in
Zone
, and select
Heart Rate Zones
or
Power Zones
.
History
15
Summary of Contents for EDGE 1030
Page 1: ...EDGE 1030 Owner sManual...
Page 31: ......
Page 32: ...support garmin com August 2017 190 02220 00_0A...