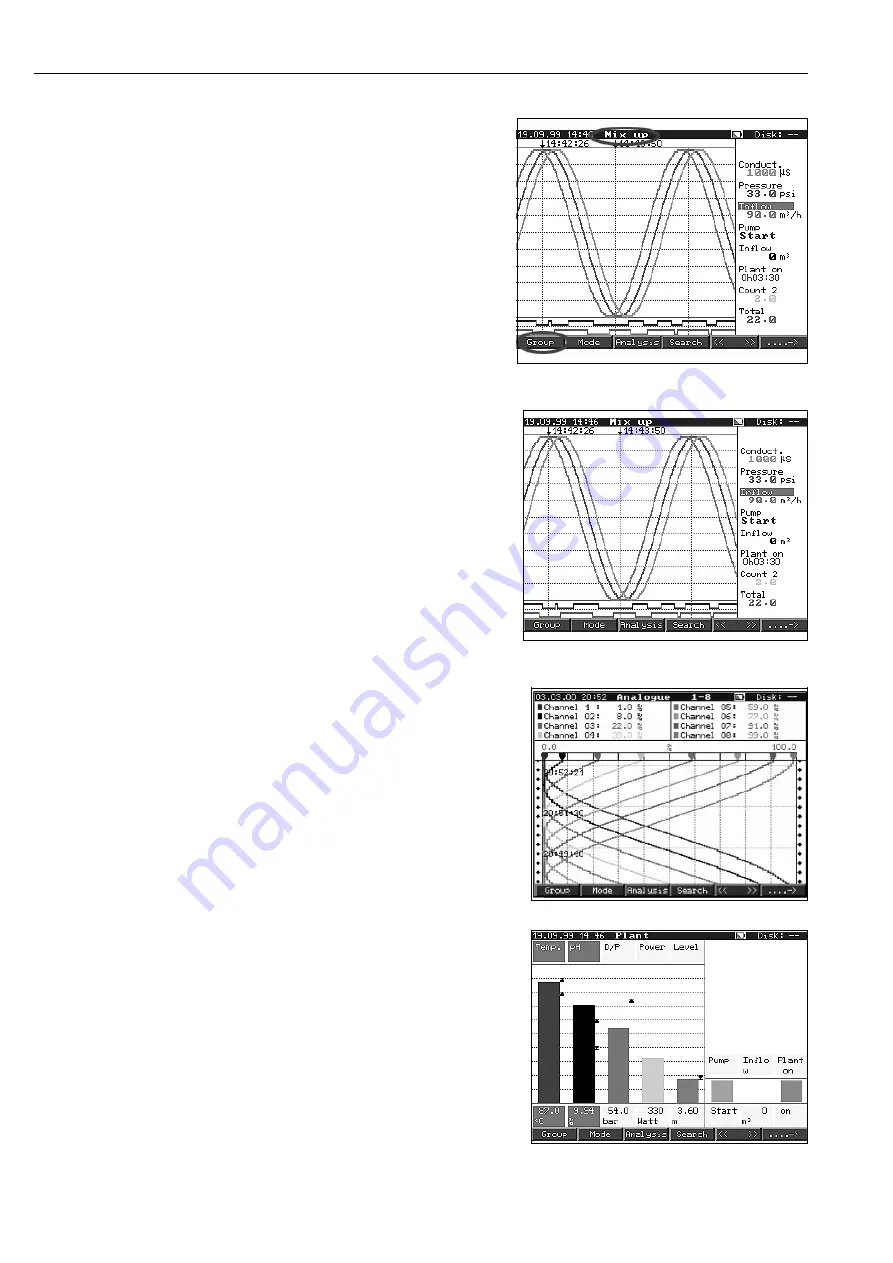
Group:
Selection of measurement point group to
be displayed.
- Measurement point (analogue and
digital) can be combined into groups
(see “Set up - make groups”). This makes
fast access to plant areas/ signals that
need to be displayed together possible.
- All relevant measurement points are
seen together (e.g. all temperatures,
plant 1 measurement points, ...).
- If the group has been renamed a
relevant name such as “Analogue
channels”, “Temperatures" etc. is
displayed instead of “Group x”. (e.g. “Calculated values”)
Mode:
Selection of how the chosen signal group
is to be displayed. This means the best
possible display mode for the active signal
group can be chosen. Individual channel
groups are always displayed in the last
selected mode. So only the group of
interest needs to be selected and the
required display mode is active.
Plot:
The channels are displayed horizontal
using the complete screen width as the
display range.
Plot in zones:
Each channel is allocated its own part
of the screen (horizontal). This means that
channel plots do not cross one another.
Waterfall:
Same as “Plot” but vertical display
Waterfall in zones:
Same as “Plot in zones” but vertical display
Bargraph:
The instantaneous value is displayed in
the form of a column (with alarm set point
markers).
6. Handling in operation
94


