Monitoring Equalizer Operation
Equalizer Installation and Administration Guide
47
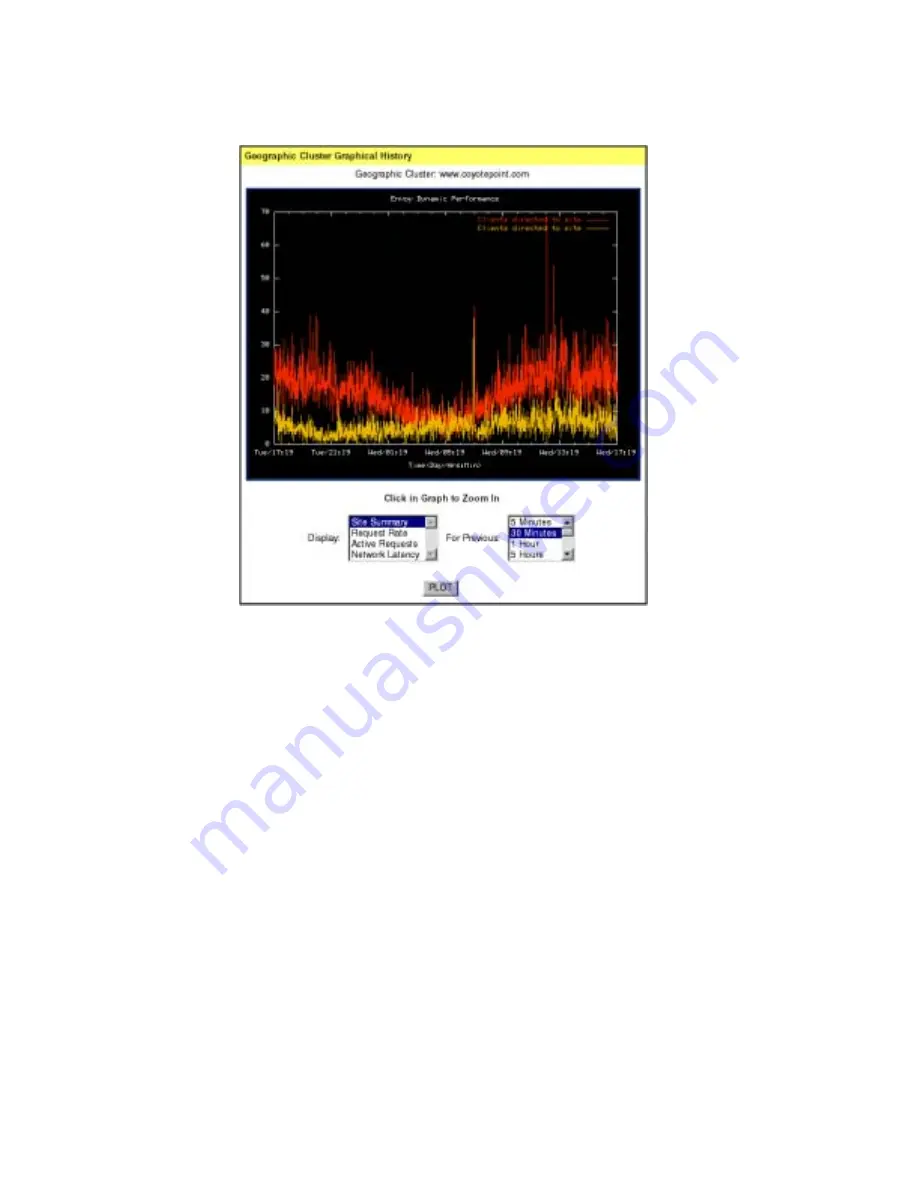
Figure 30 Viewing a geographic cluster’s graphical history
By default, the site summary for the previous half hour is displayed. To change the
information plotted, select the categories and duration you want to plot and click the
Plot
button.
To zoom in on a portion of the graph, click the area that you are interested in.
Four values can be plotted for a cluster:
■
Request Rate
—the number of requests received for the cluster per minute.
■
Active Requests
— the number of requests that Equalizer is in the process of routing.
■
Network Latency
—the average triangulation time when at least one site was able to
respond. (Excludes clients for which the default site was selected.)
■
Site Summary
—Shows the number of requests directed to all sites in the cluster for
the duration specified. This plot is displayed by default when the plot site page is
opened. Note that the site summary can only be displayed separately; you cannot plot
the site summary on the same graph as the other values.
Summary of Contents for Equalizer
Page 2: ......
Page 4: ...iv Coyote Point Systems Inc ...
Page 32: ...Chapter 2 Installing Equalizer 22 Equalizer Installation and Administration Guide ...
Page 42: ...Chapter 3 Configuring Equalizer 32 Equalizer Installation and Administration Guide ...
Page 108: ...Chapter 7 Troubleshooting 98 Equalizer Installation and Administration Guide ...
Page 114: ...Appendix B Using Reserved IP Addresses 104 Equalizer Installation and Administration Guide ...
Page 118: ...Appendix C Regular Expression Format 108 Equalizer Installation and Administration Guide ...
Page 130: ...Appendix E Technical Specifications 120 Equalizer Installation and Administration Guide ...
Page 136: ...Appendix F License and Warranty 126 Equalizer Installation and Administration Guide ...


