125
Web
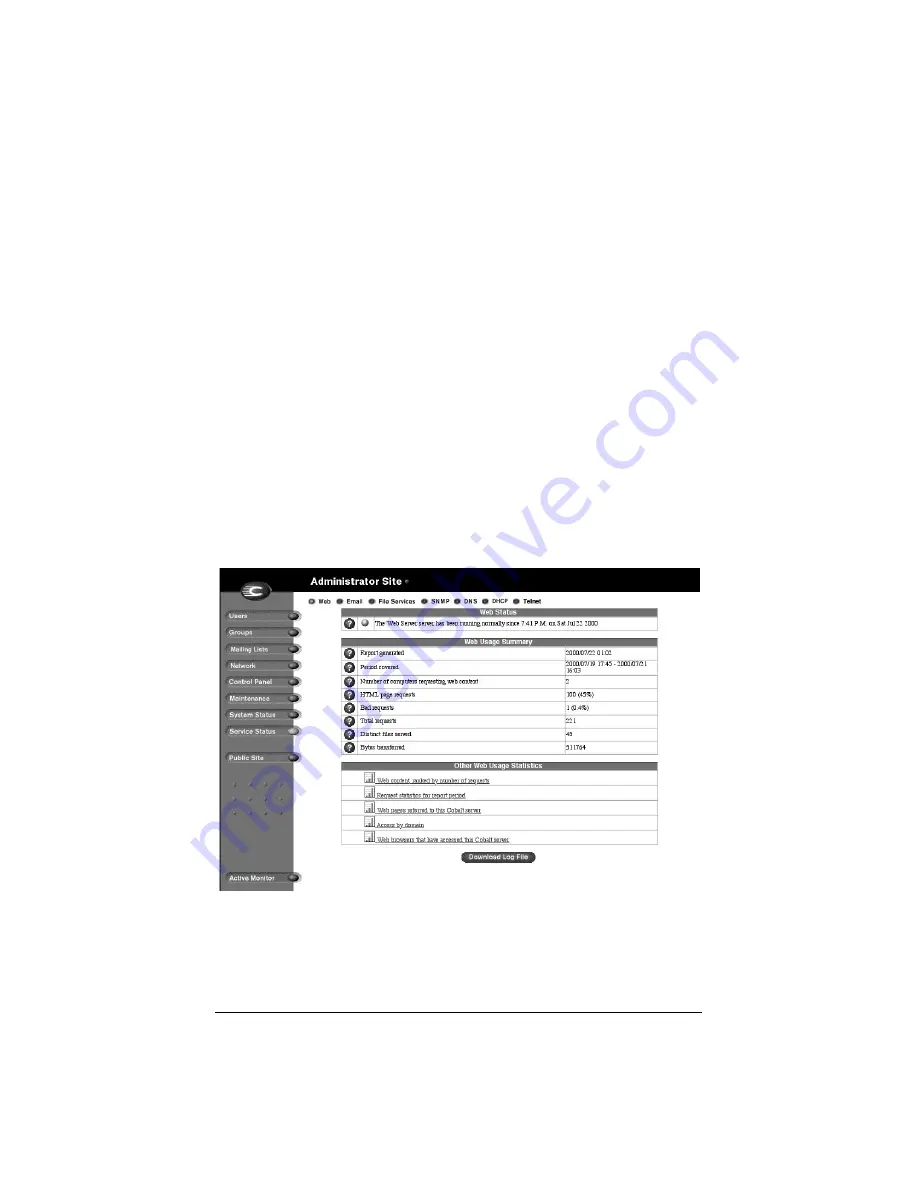
The Web Server Status chart displays the status of the Web server
(green, yellow, red or grey).
The Usage Summary chart provides you with a comprehensive analysis
of Qube 2 usage. It outlines Web usage, based on number and types of
requests.
You can click
Download Log File
to save the statistics in a log file on
your personal computer.
Other Web Usage Statistics includes:
•
Web content, ranked by number of requests
•
Request statistics
•
Web pages referred to this Cobalt server
•
Access by domain
•
Web browsers that have accessed this Cobalt server
Figure 41 shows a sample of the Web-usage statistics.
Figure 41 Sample of Web usage statistics
Summary of Contents for Cobalt Qube 2
Page 1: ...Cobalt QubeTM 2 User Manual...
Page 6: ...vi...
Page 20: ...Chapter 1 6 Figure 3 Administrator Site screen Figure 4 Public Site screen...
Page 26: ...Chapter 1 12...
Page 68: ...Chapter 3 54...
Page 70: ...Chapter 4 56 Figure 17 Administrator Site screen...
Page 76: ...Chapter 4 62 Figure 19 shows the User Defaults table Figure 19 User Defaults table...
Page 78: ...Chapter 4 64 Figure 20 shows the Add New User table Figure 20 Add New User table...
Page 87: ...Administrator Site 73 Figure 24 shows the Add New Group table Figure 24 Add New Group table...
Page 184: ...Appendix B 170...
Page 206: ...Appendix E 192...
Page 218: ...Appendix F 204...


