


64
Graph
On the graph, the satellites that are closer to the outer circle are closer to the horizon and will typically have more errors
due to the longer distance the signal has to travel and atmospheric disturbances. The second ring from the outside
represents 30 degrees above the horizon. The third ring from the outside represents 60 degrees above the horizon. The
center of the circle represents 90 degrees above the horizon (ex. directly overhead).
North is to the top of the circle. The rest of the directions correspond to the normal directions on a map (West to the left,
East to the right, and South to the bottom). Satellites shown as circles are GPS and satellites shown as square boxes are
GLONASS. The numbers on each icon represent the satellite’s PRN. By looking at this figure, all the GPS and GLONASS
satellites can be located in the sky.
For the high position accuracy, it is best to have satellites scattered throughout the sky with at least one in each quadrant
as well as at different elevations. Fives satellites spread out provides a more accurate position than five satellites bunched
together near each other. Though the signals from satellites right next to each are counted as two tracked satellites, their
effective value to the position fix is as if there were only one. This graph can help tell if the satellite constellation has poor
geometry for providing position fixes.
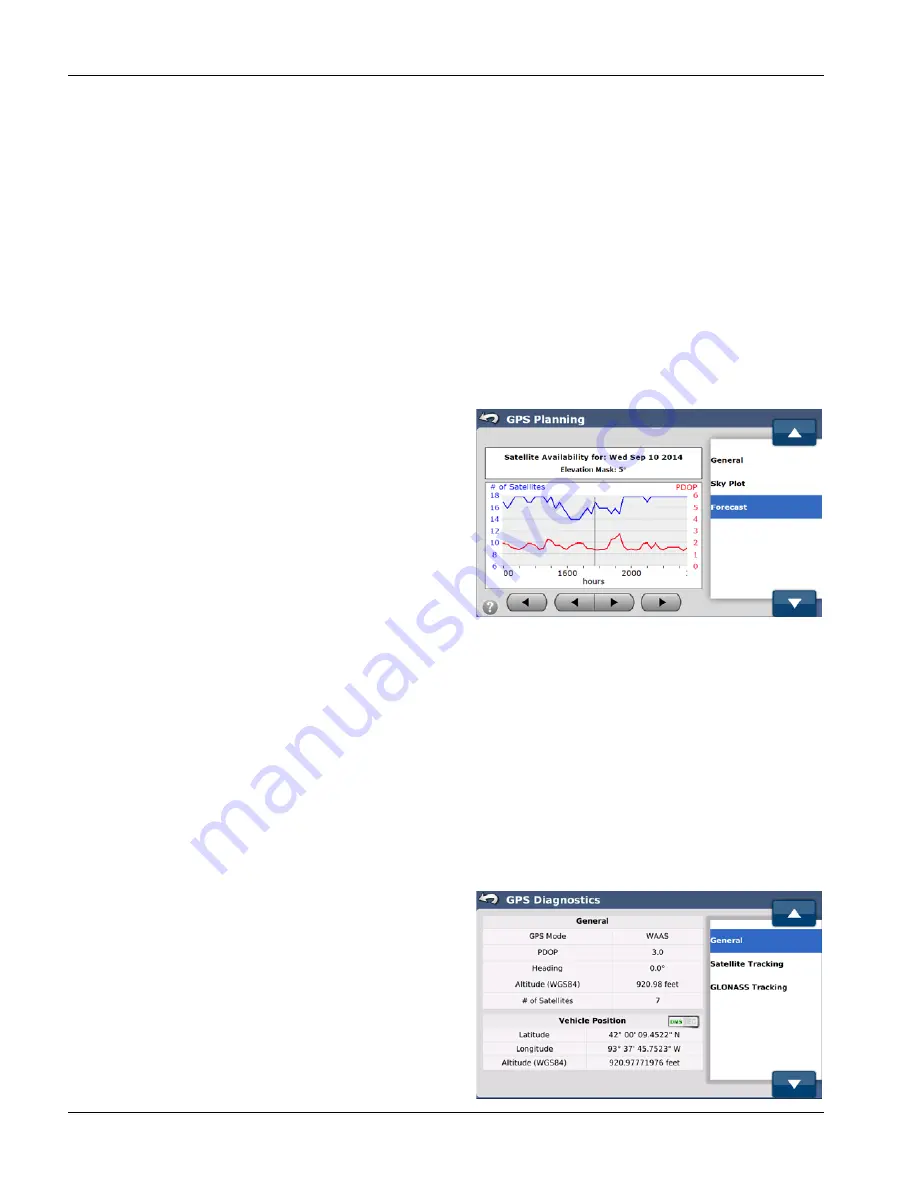
FORECAST
The Forecast screen shows satellite availability and predicted
accuracy for a specific date and time range.
To access the Forecast screen, select the GPS tab from the main
AutoSteer Setup screen, press the Planning Tool button, and
then select Forecast from the list on the right.
The information and buttons available in the Forecast screen are:
Satellite Availability Box
—This box at the top screen provides
the date for the data in the graph and elevation mask being
used.
Graph
—This is a graphical representation of the number of
GNSS satellites the system is predicted to be able to be seen by
the GeoSteer and the corresponding PDOP (position quality) of the constellation at that time. The current time is indicated
by the black vertical line on the graph.
Inside Gray Arrows
—Pushing these two buttons shifts the time displayed on the graph left or right by two hours every
time they are pushed. This allows the operator to see what the conditions will be or were at different times.
Outside Gray Arrows
—Pushing these two buttons shifts the day displayed on the graph back or forward one day at a
time when they are pushed. This allows the operator to see how the conditions will change from a day to day perspective.
The blue line represents the number of GPS and, if unlocked, GLONASS satellites that should be available throughout the
time period shown. The red line represents the predicted PDOP over the same time period. Higher satellites counts are
better and lower PDOP values are better. If accuracy is critical, operators can plan field operations around poor satellite
availability and high PDOP.
GPS DIAGNOSTICS
The GPS Diagnostics screen provides information about the GPS
signals. The information provided can help to troubleshoot GPS
problems and verify the system is providing the correct
information.
To access the GPS Diagnostics screen, select the GPS tab from
the main AutoSteer Setup screen and then press the GPS
Diagnostics button.
The options that can be available in the GPS Diagnostics screen
are:
General
—basic information about the GPS data