Chapter 10 Using HiveManager
114
Aerohive
Help: Access a comprehensive online context-sensitive Help system. Internet access is required to view the Help
files at their default location. You can also download the Help files from Aerohive Support and post them on a local
HTTP server if you like. In addition to Help files, you can also access product documentation and online
computer-based training modules by clicking the down arrow to the right of the Help button.
Navigation Tree: The navigation tree contains all the topics within the GUI section that you chose in the menu bar.
Items you select in the navigation tree appear in the main panel.
Main Panel: The main panel contains the windows in which you set and view various parameters.
Notifications: HiveManager displays a summary of new HiveAPs, rogue clients, rogue APs, and alarms detected on
managed HiveAPs here. Clicking a displayed number opens the relevant page with more details.
Some convenient aspects that the HiveManager GUI offers are the ability to clone configurations, apply
configurations to multiple HiveAPs at once, and sort displayed information. Brief overviews of these functions are
presented in the following sections.
Viewing Reports
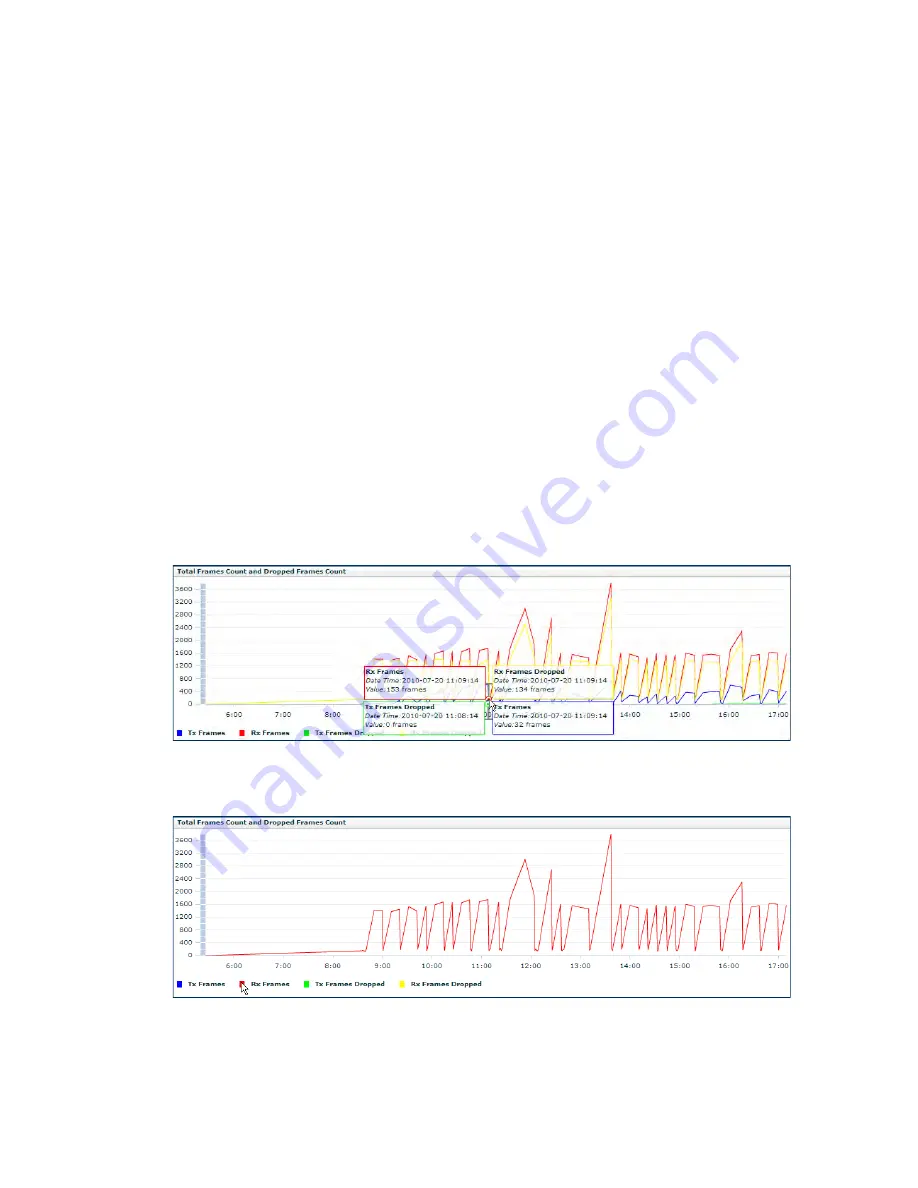
When viewing reports that contain graphs (Monitor > Reports …), you can use your mouse to control what
information HiveManager displays. Moving your mouse over a measurement point on any line in a graph displays the
type of data being reported and the date, time, and value of the measurement. In the graph for active client details
(Monitor > Clients > Active Clients > client_mac_addr) or a report defined as a "New Report Version", moving your
mouse over a color box in the legend hides all other lines except the one matching that color (see
Figure 5
).
Figure 5
Working with graphs in reports
Moving the mouse over a measurement point in a graph displays data about that measurement. If measurement
points on multiple lines happen to converge at the same point, HiveManager displays data for all of them. Here you
can see information about the total number of transmitted (Tx) and received (Rx) frames and dropped frames.
In the graph showing details for a selected active client, moving the mouse over a colored box in the legend hides all
other lines except the one that is the same color as the box under the mouse. Here HiveManager only shows the red
line for transmitted frames because the mouse is over the red box next to Rx Frames in the legend.
Summary of Contents for access point
Page 1: ...Aerohive Deployment Guide ...
Page 7: ...HiveAP Compliance Information 6 Aerohive ...
Page 13: ...Contents 12 Aerohive ...
Page 37: ...Chapter 2 The HiveAP 20 ag Platform 36 Aerohive ...
Page 71: ...Chapter 4 The HiveAP 340 Platform 70 Aerohive ...
Page 81: ...Chapter 5 The HiveAP 320 Platform 80 Aerohive ...
Page 105: ...Chapter 8 The High Capacity HiveManager Platform 104 Aerohive ...
Page 123: ...Chapter 10 Using HiveManager 122 Aerohive ...
Page 209: ...Chapter 14 Deployment Examples CLI 208 Aerohive ...


