SonTek RS5 User Manual (August 2020) 85
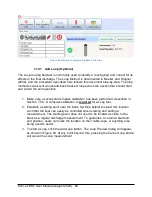
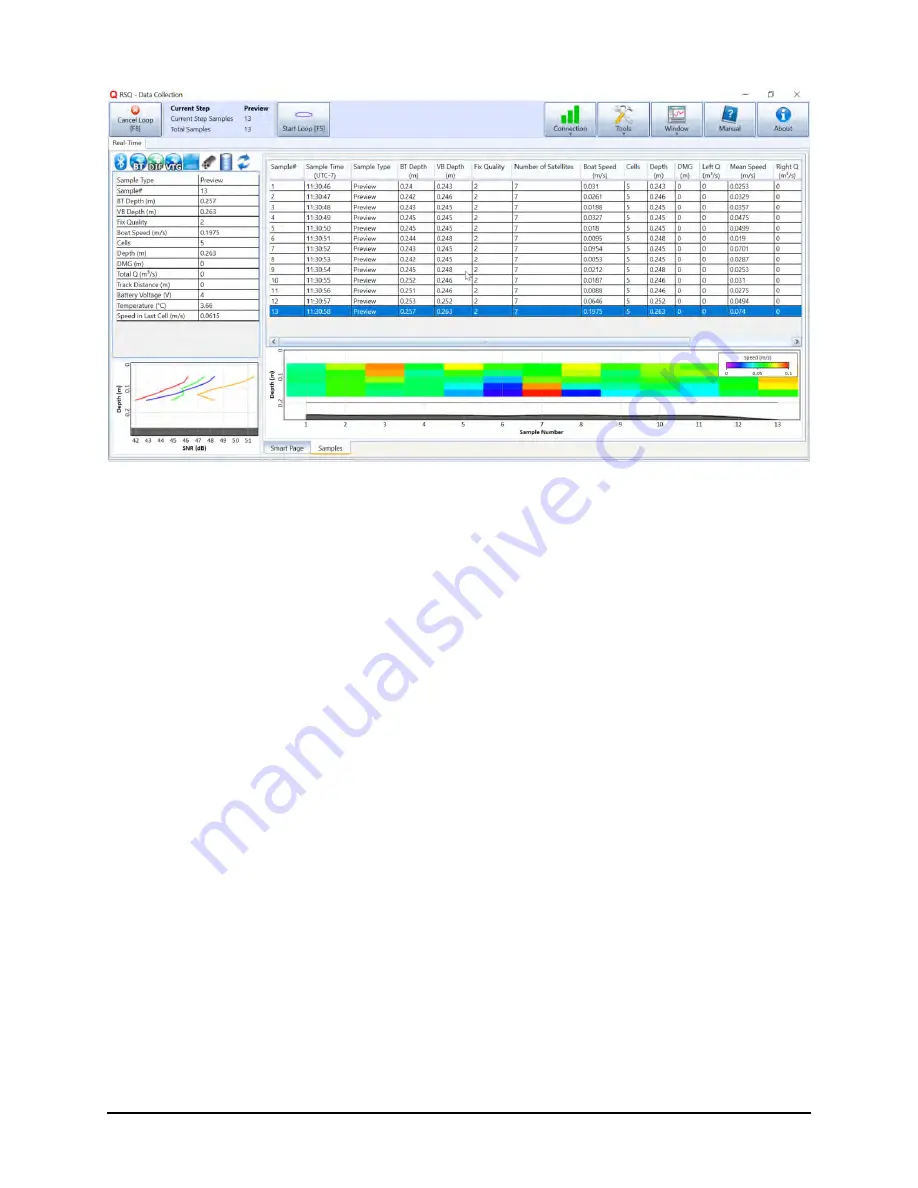
Figure 63. Add Loop Preview
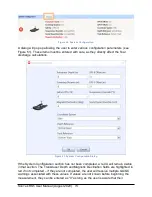
4. Ensure that the RS5 is stationary and at the starting point of the loop
measurement. The preview dialog allows the user to view profiling data before
recording the loop measurements – please ensure that valid data cells appear
and that the data conform to expectations at that site before proceeding. If data
look satisfactory, press the Start Loop button (or use the [F5] key) to begin the
loop measurement.
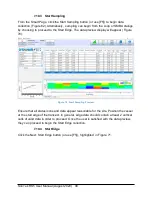
5. Once started, the Loop measurement data will appear, as shown in Figure 64,
and the user should begin moving the RS5 across the section. By default, the
Boat Speed and Boat/Water Speed Ratio will be plotted on top. It is essential that
the user maintain a steady, slow boat speed throughout the out-and-back
transect. Per the recommendation from Mueller and Wagner (2006), the boat
speed should be the lesser of a.) the boat speed that re-quires no less than 3-
minutes to complete the loop or b.) the boat speed that is less than 1.5 times the
mean water speed. The ship track and velocity profile are also plotted.


