


Management Software
Using HarnessEye/web
299
This window displays 10 log entries at a time, starting with the latest error and
proceeding in reverse chronological order.
❖
Header Information - Displays header information
❖
Event Type - An icon indicating the event type
❖
Event Time - The date and time the event occurred
❖
Sensor Type/Sensor Name - The type and name of the sensor involved
❖
Message - A detailed message
❖
Right arrow button - Displays the next 10 (older) log entries
❖
Left arrow button - Displays the previous 10 (newer) log entries
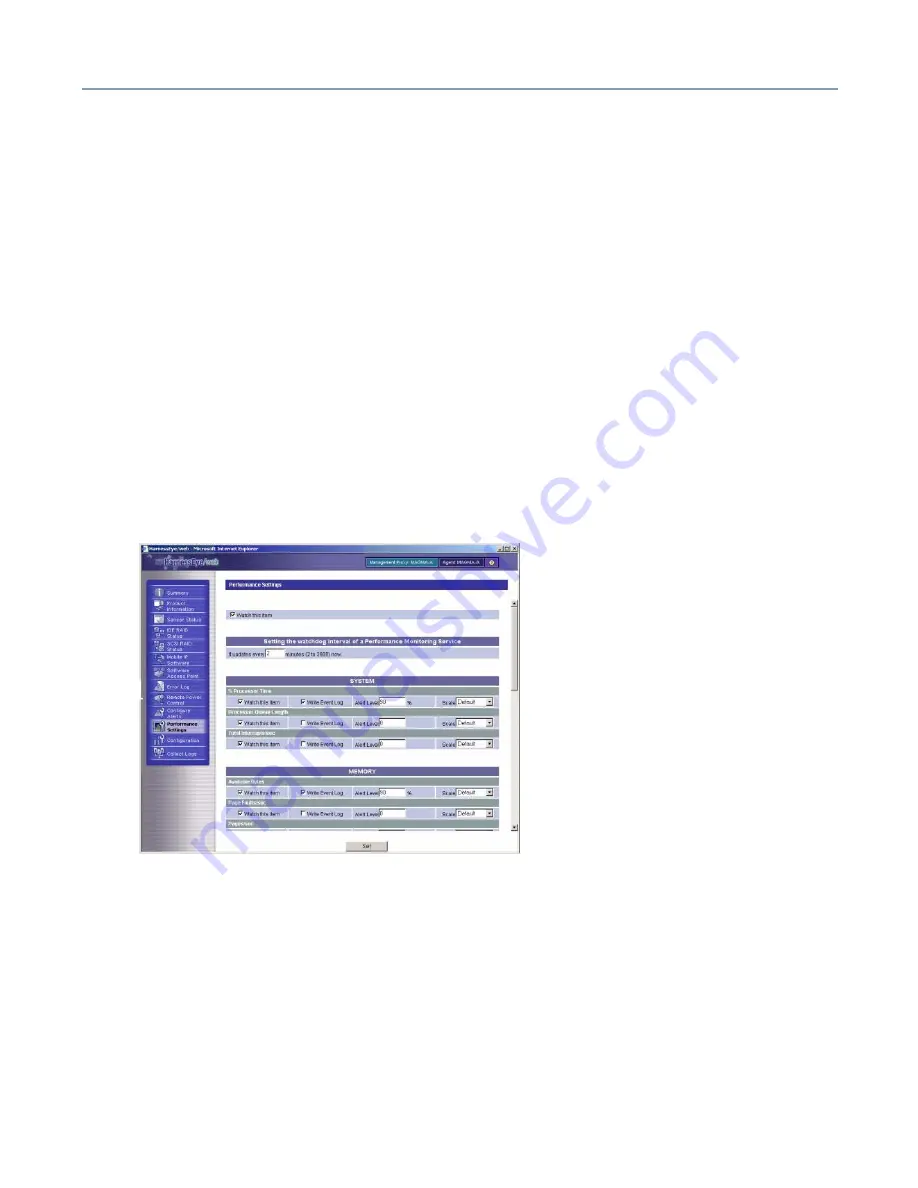
Performance Settings Screen
When you click Performance Settings for an Agent in the tree on the left pane of the
Summary Information screen, the following screen displays:
This screen sets the thresholds for current utilization of the CPU and memory.
For Performance Settings:
❖
Watch this Item - Select this check box to specify performance settings be monitored
❖
Watchdog Interval Edit box - Specify the threshold with a number from 2 to 3800
For the CPU:
❖
Watch this Item - Specify the CPU condition to be monitored
❖
Write Event Log check box - Select this check box to write to the event log when CPU
utilization exceeds the threshold
Содержание Magnia Z310
Страница 1: ......
Страница 19: ...19 ...
Страница 413: ...413 Other optional items Slot Maker Model No Type No Setting and others Date installed Serial port COM1 USB1 USB2 ...


