Rotor-Gene Q MDx CE User Manual 02/2022
178
11.
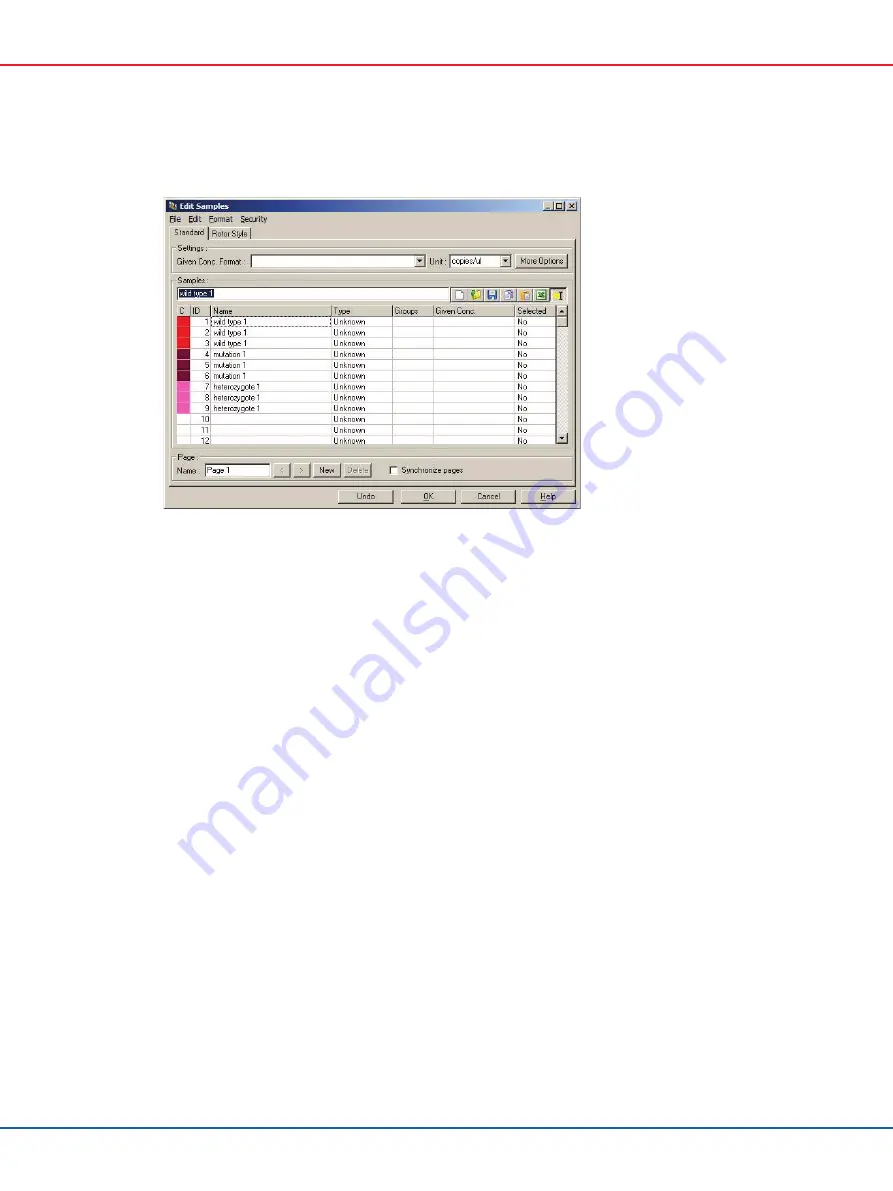
Edit the sample names (optional). Sample names can be edited during or after a run.
10.8
Real-time PCR data analysis
Analysis of the real-time PCR data prior to HRM data analysis is advantageous. Real-time PCR data
can highlight poorly performing assays. Identifying these outliers and filtering them out of
subsequent HRM analysis will greatly improve the overall effectiveness of HRM analysis, since
analyzing poor-quality PCR product will result in poor HRM results. We recommend analyzing
quantitative real-time PCR data as follows.
1.
Analyze the real-time data using the
Quantitation
option from the
Analysis
window. If any C
T
values are 30 or higher, the corresponding reactions are considered to have amplified too
late. These samples must be analyzed with suspicion or removed from the analysis as an
outlier. Late amplification is usually due to too little starting template amount and/or high
levels of sample degradation.
2.
Assess the end-point fluorescence level. If end point fluorescence in any of the amplification
plots is low compared with the majority of plots in the data set, omit those samples from the
analysis even if their C
T
value is less than 30. Low end-point fluorescence can indicate
incorrect dye amount, incorrect levels of reaction components (such as primers), or the action
of inhibitors.
3.
Use the
Comparative Quantitation
option from the
Analysis
window to obtain the reaction
efficiency of each sample. If the efficiency is not similar to other reactions in the experiment,
or is less than approximately 1.4, omit the reaction as an outlier.


