Rotor-Gene Q MDx CE User Manual 02/2022
107
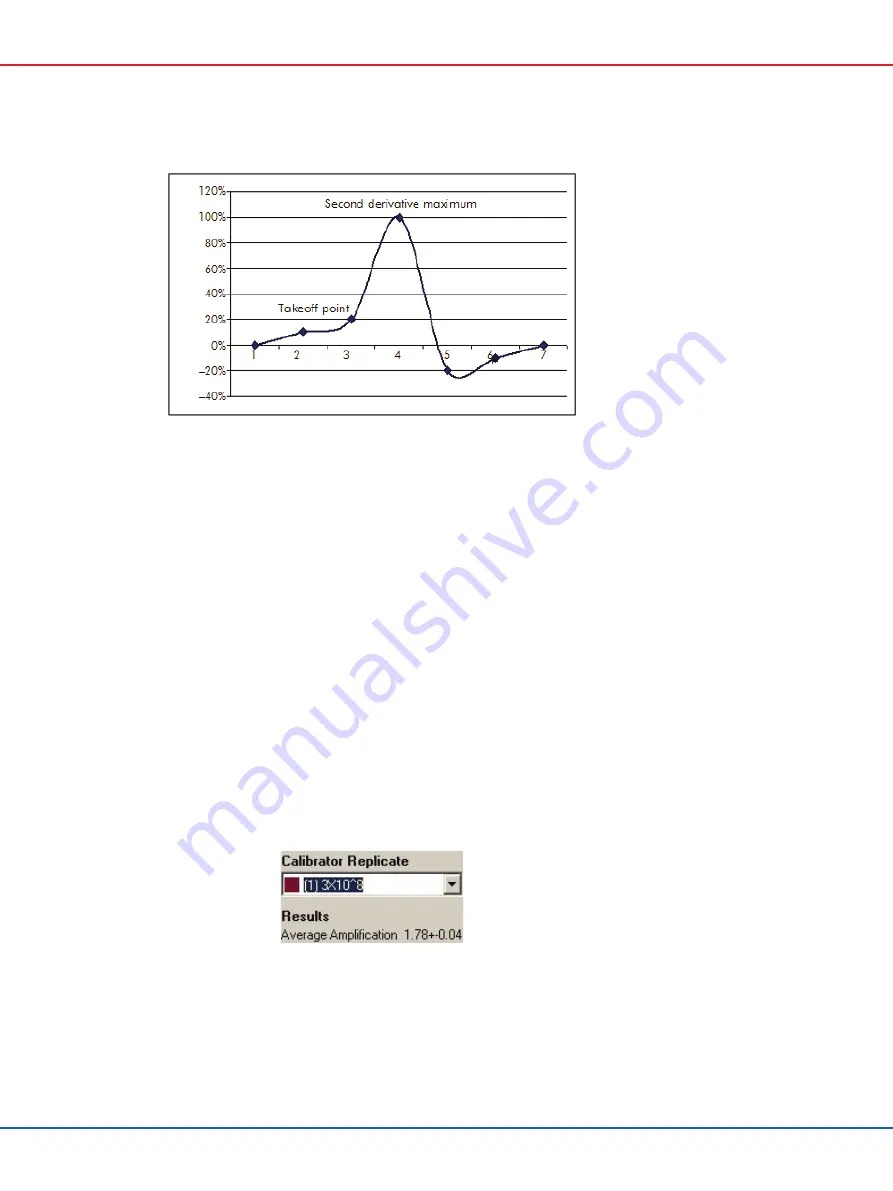
The “Amplification” column provides the efficiency of the sample. A 100% efficient reaction would
result in an amplification value of 2 for every sample, which means that the amplicon has doubled
in every cycle. In the raw data, the signal should be doubling in the exponential phase. For
example, if the signal was 50 fluorescence units at cycle 12 and then 51 fluorescence units at cycle
13, it should increase to 53 fluorescence units at cycle 14. All of the amplification values for each
sample are averaged to produce the amplification value that is shown on the right of the screen
under the toggler. The greater the variation between the estimated amplification values of each
sample, the larger the confidence interval will be (indicated by the value after the ± sign). The
confidence interval, for a large sample number (N), gives a 68.3% probability that the true
amplification of the samples lies within this range (1 standard deviation). By doubling the ± interval,
a 95.4% confidence interval for a large N is achieved.
Calibrator Replicate
As in the delta delta C
T
method, a calibrator sample is required, and measurements are relative to
this calibrator sample. Replicates of the calibrator can be analyzed since, if multiple sample
positions have the same name, the average of the takeoff points of these samples will be used. To
use this feature correctly, ensure that replicates have identical names.
The average amplification is used to calculate expression. For example, a sample with a low
amplification value will take longer to reach a certain absolute copy number than a sample with a
higher amplification value. The “Rep. Conc.” column of the
Comparative Quantitation Results
window provides the relative concentration. The relative concentration of each sample compared


