Chapter 4
Flow-mode option
Page 4-8
MAN 0487
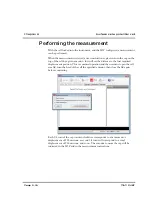
Measurement tab
This
Measurement
tab displays the measurement details. These are the same
details as entered when the measurement was first performed. Refer to the
appropriate SOP windows -
Sample
and
Flow settings
- for more details.
The
Edit settings
button will display the standard
Edit result
window where the
measurement details and parameters can be inspected and edited.
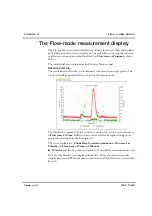
Traces tab
The
Traces
tab displays the traces available for viewing on the plot. The traces
available will be determined by the flow-mode system arrangement and the
measurement signals analysed.
The available traces could be the
Z-average mean
,
Intensity
,
RI
(Refractive
Index) and
UV
. When
RI
is selected using the drop-down menu, the
Delay
Volume
,
Offset
and
Gain
values will be displayed; These are the values entered in
the
External Inputs
SOP window when the SOP was originally performed. Refer
to the
Flow-mode SOPs
section.
Note that the default
External Inputs
values are defined in the
Options
window,
explained later in this chapter.
Peaks tab
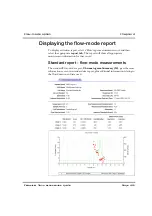
The
Peaks
tab displays all the details about the calculated peaks shown in the flow-
mode plot. To display a peak's details either select a blue peak bar in the plot, or
select one of the peaks identified at the top of the peak tab; the details in the tab will
reflect the data appropriate to that peak. The selected peak will be highlighted on
the plot. (The details displayed are the same as shown on the
Chromatogram
summary
report).
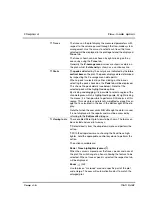
The features of the
Peaks
tab are:
Peaks identified
box
This shows all the peaks identified in the measurement and
plot. Selecting a peak will display its details in the accompa-
nying boxes.
To show or hide a peak in the plot, select or de-select the
check box alongside the peak.
Hide all
Press this button to hide all identified peaks. Peaks can be
displayed again by selecting the peak check box.
Remove
This will remove the highlighted peak in the Peaks identified
box. When pressed, a message is displayed to warn that the
peak will be removed permanently.
Start vol. / End
vol.
This shows, in mL, the start and end volume points for the
peak.
Peak analysis
details
Displays the results from the measurement:
Molecular
weight
,
Z-average
,
Width
and
Intensity
area
.
Содержание Zetasizer Nano Series
Страница 2: ......
Страница 3: ...Zetasizer Nano accessories guide MAN0487 Issue 1 1 April 2013...
Страница 12: ...Chapter 1 Introduction and accessory range Page 1 6 MAN 0487...
Страница 42: ...Chapter 2 General cells and cuvettes Page 2 30 MAN 0487...
Страница 98: ...Chapter 5 Microrheology Page 5 20 MAN 0487...
Страница 125: ......


