Function app
51
Plot the
functions
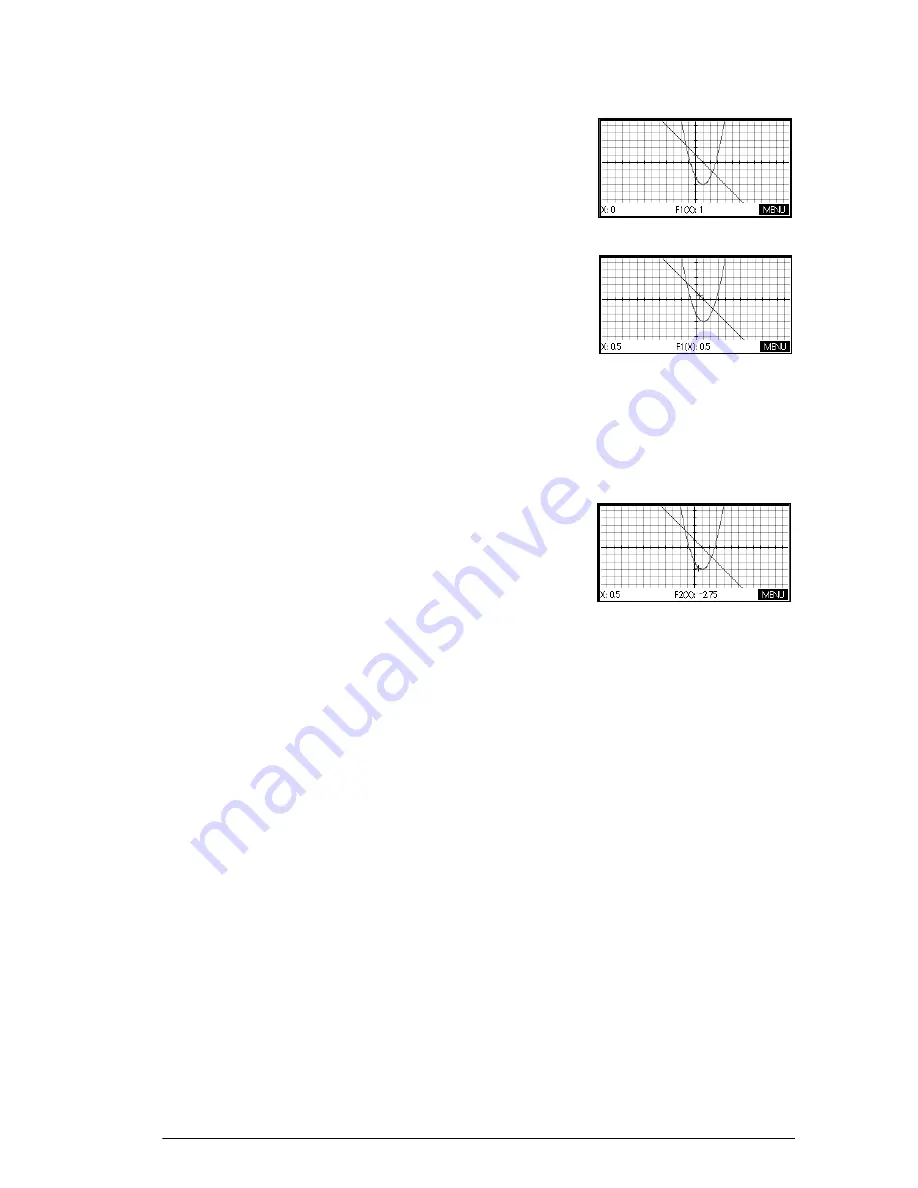
5. Plot the functions.
P
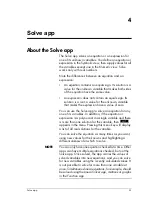
Trace a graph
6. Trace the linear function.
>
or
<
Note: by default, the tracer is active.
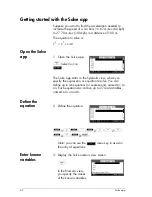
7. Jump from tracing the linear function to the quadratic
function.
=
or
\
Change the
scale
You can change the scale to see more or less of your
graph. This can be done in four ways:
•
Press
+
to zoom in or
w
to zoom out on the
current cursor coordinates. This method uses the zoom
factors set in the Zoom menu. The default for both x
and y is 2.
•
Use the Plot Setup to define
XRNG
and
YRNG
exactly
as you want.
•
Use the Zoom menu to zoom in or out, horizontally or
vertically, or both, etc.
•
Use the Views menu to select a pre-defined window.
You can also use
Autoscale
, in either the Zoom or Views
menus, to choose a vertical range for the current
horizontal range, based on your function definitions.
Содержание 39gII
Страница 1: ...HP 39gII graphing calculator user s guide Edition1 Part Number NW249 90001 ...
Страница 2: ...Printing History Edition 1 November 201 1 ...
Страница 32: ...22 Getting started ...
Страница 58: ...48 Apps and their views ...
Страница 70: ...60 Function app ...
Страница 80: ...70 Solve app ...
Страница 132: ...122 Parametric app your own table and the split screen functionality available in the Function app ...
Страница 136: ...126 Polar app ...
Страница 140: ...130 Sequence app ...
Страница 148: ...138 Finance app ...
Страница 152: ...142 Linear Solver app ...
Страница 218: ...208 Matrices ...
Страница 226: ...216 Notes and Info ...
Страница 238: ...228 Variables and memory management ...
Страница 318: ...308 Programming ...
Страница 340: ...330 Reference information ...
Страница 346: ...vi Product Regulatory Information ...


