PROCESS INFORMATION DISPLAYS
6510020335
149
6.10.5
Units
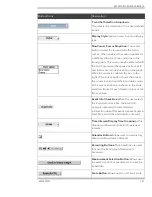
The Units combo box allows you to change the units.
6.10.6
Profile Magnification
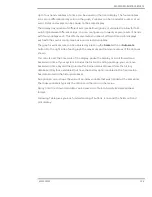
The Zoom In button magnifies the profile and the Zoom Out button decreases the
magnification of the profile.
6.10.7
Cursor
You can use the cursor, provided on graph, to display the profile value of any point. Select
the cursor by clicking on the vertical yellow line and dragging the line (the cursor) to any
point on the profile. The Bin value column displays the profile value at the cursor location.
A NaN (Not A Number) is displayed if no data is available at the cursor location.
6.11
High Resolution Profile Display
This display allows operators to view a single profile distributed over three graphs
–
thus
allowing you to see the profile at a higher resolution. These profiles show the CD variations
for the selected variable. The vertical axis in profiles represents the value of the variable
being measured or monitored. You can select the horizontal axis to display the cross-
direction position in a variety of measurement units; for example, millimeters, inches, or
bins. The Green Lines on the graph shows that data is within limits. The RED line on the
graph shows that data is out of limits.
Содержание Experion MX
Страница 1: ...Experion MX RELEASE 702 1 Operators Guide 6510020335 Rev 02 May 2019 ...
Страница 7: ...6510020335 7 8 NOTICES 168 ...
Страница 20: ...SCANNER SAFETY AND LOCAL CONTROLS 6510020335 20 Fig 15 Cable End Voltage Zones ...
Страница 21: ...SCANNER SAFETY AND LOCAL CONTROLS 6510020335 21 Fig 16 Distant End Voltage Zones ...
Страница 124: ...PROCESS INFORMATION DISPLAYS 6510020335 124 Fig 105 Profile Display ...
Страница 159: ...PROCESS INFORMATION DISPLAYS 6510020335 159 Fig 148 Precision Platform 4000 01 Scanner ...
Страница 160: ...PROCESS INFORMATION DISPLAYS 6510020335 160 Fig 149 Precision Platform 4000 20 21 Scanner ...


