PROCESS INFORMATION DISPLAYS
6510020335
139
6.8.2
Trend Graph and Data
Fig. 120.
Trend Graph and Data
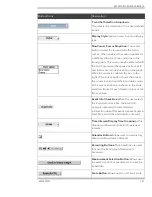
Graph Data and Controls
The Graph Data and Controls show data for graph and allow setting of the graph
parameters.
Fig. 121.
Graph Data and Controls
•
Scale Button
: Use this feature to manually set the trend plot range so that it fits in
the area provided. To activate, click on the button and a pop-up dialog box appears.
•
Auto Scale Button
: Use this feature to automatically scale the trend plot range so
that it fits in the area provided. To activate, click on the button and the range and
trend on the graph updates.
•
Max Button
: Use this feature to automatically position the cursor at position with
the maximum value.
Содержание Experion MX
Страница 1: ...Experion MX RELEASE 702 1 Operators Guide 6510020335 Rev 02 May 2019 ...
Страница 7: ...6510020335 7 8 NOTICES 168 ...
Страница 20: ...SCANNER SAFETY AND LOCAL CONTROLS 6510020335 20 Fig 15 Cable End Voltage Zones ...
Страница 21: ...SCANNER SAFETY AND LOCAL CONTROLS 6510020335 21 Fig 16 Distant End Voltage Zones ...
Страница 124: ...PROCESS INFORMATION DISPLAYS 6510020335 124 Fig 105 Profile Display ...
Страница 159: ...PROCESS INFORMATION DISPLAYS 6510020335 159 Fig 148 Precision Platform 4000 01 Scanner ...
Страница 160: ...PROCESS INFORMATION DISPLAYS 6510020335 160 Fig 149 Precision Platform 4000 20 21 Scanner ...


