62
Operating the device
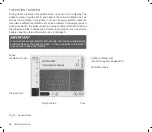
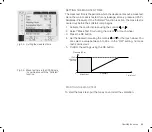
Immediately after the activation of the curve screen during ventilation, the
curves are set up over the set period of time. The curves are then replaced
with the new values. The current ventilation status is shown via a white
progress bar.
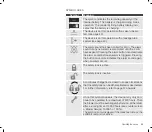
If a new calculation of the curve starts at the beginning of the time axis,
this symbol is brie
fl
y shown in the upper right of the screen:
The recording of the curves within the time axis is indicated by the follow-
ing symbol:
“FREEZING” THE CURVE SCREEN
To analyze and evaluate the curves, it is possible to “freeze” the current
curve recording. To do this, press the OK button. This symbol indicates
that the curve is “frozen”:
To start recording the curves again, press the OK button. The curve record-
ing subsequently starts again at zero.
SCALING THE TIME AXIS
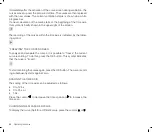
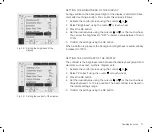
The scaling of the time axis can be adjusted as follows:
•
0 to 12.5 s,
•
0 to 25 s or
•
50 s.
Press the cursor , to decrease the time span and to increase the
time span.
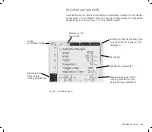
CHANGING THE MEASURED VALUE
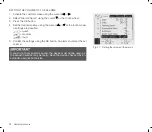
To display the curve chart for a different value, press the cursors or .
Содержание TRENDvent
Страница 103: ...Notes 103 NOTES ...

