Collecting and Analyzing FRF Data
dataPAC User’s Guide
233
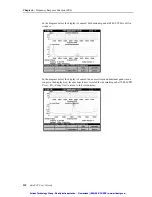
To determine resonant frequencies using accelerance
When you strike the structure with the impact hammer broad band energy across the entire
frequency spectrum (dependent on hammer, tip, frequency range selected) is put into the
structure. If you consider that the energy is distributed equally across the frequency range,
frequencies which show a high accelerance can be considered to be excited at that particular
frequency. In some plots, you may notice that the frequency spectrum dips to or very close
to zero. This indicates anti-resonances. The display below shows both of these conditions.
Importance of coherence in FRF testing
Coherence is a measure of the repeatability and reliability of the data collected. Just as
averaging is considered necessary for reliable FFT data, averaging is also necessary for good
FRF testing.
Coherence measures the input and output to determine how closely the data sample just
collected matches with the data already averaged. Coherence is always expressed on a scale
of 1.0 with 1.0 having the highest confidence level.
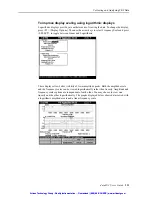
You can select coherence as one of the display traces when analyzing data. Although you
can select coherence after collecting data, viewing it while collecting data immediately
determines if your data is good. In the display shown below, the coherence trace was
swapped from the top trace to the lower trace to provide more detail.
Artisan Technology Group - Quality Instrumentation ... Guaranteed | (888) 88-SOURCE | www.artisantg.com
Artisan Technology Group - Quality Instrumentation ... Guaranteed | (888) 88-SOURCE | www.artisantg.com


