Collecting and Analyzing FRF Data
dataPAC User’s Guide
229
To pinpoint data using the cursor
Like all dataPAC graphical displays, you can move the cursor with the arrow keys to
precisely read the corresponding values. The cursor in the FRF module consists of a circle
and crosshair that follows the peaks and valleys in the data as you move it along the axis.
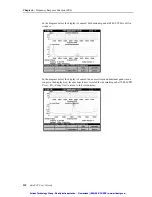
In the example below, the cursor is on the resonant frequency occurring at 48,820 CPM. The
amplitude is also displayed at the bottom of the screen. In this example, the amplitude is
11.775 g/Pound-Force and is clearly the highest amplitude in the displayed spectrum.
To zoom in and zoom out
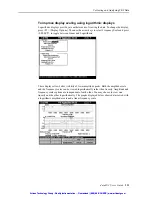
The dataPAC normally uses the auto scale to fit the data in the display. When you see a very
large dominant peak, as in the example below, you can selectively zoom in on the display to
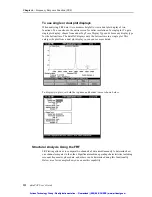
see smaller peaks. Each time you press <F4> (Zoom In), the dataPAC shows a smaller
portion of the spectrum centered around the cursor. The following diagrams show repeated
zooming on the spectral display centered on the small peak to the right of the dominant
peak.
Artisan Technology Group - Quality Instrumentation ... Guaranteed | (888) 88-SOURCE | www.artisantg.com
Artisan Technology Group - Quality Instrumentation ... Guaranteed | (888) 88-SOURCE | www.artisantg.com


