Dell SonicWALL Secure Mobile Access 8.5
Administration Guide
309
Monitoring on the Local Tab
The Local tab displays statistics and graphs for the local appliance. Graphs are displayed for Web Server Status
and WAF Threats Detected & Prevented. For the latter, you can use the Perspective options to change the view
between Signature, Severity, and Server, and you can display the statistics in list format rather than as graphs.
Using the Control Buttons
The control buttons are displayed at the top of the page. They control the statistics that are displayed on this
page. On the Local tab, you can use the control buttons to turn streaming updates on or off, refresh the data on
the page, clear the graphs, and download a report. If streaming is turned on, Web Application Firewall statistics
information is fetched periodically, and displayed in the graphs and threat list. If streaming is turned off, no
new information can be displayed.
To use the control buttons, complete the following steps:
1 Select the
Local
tab. The active tab name is displayed in red or pink, while the inactive tab name is
blue. The control buttons act on the page that is currently displayed.
2 To turn streaming on or off, click the
ON
or
OFF
indicator next to
Streaming Updates
.
3 To refresh the display, click
Refresh
.
4 To clear all Web Application Firewall statistics from the graphs and list, click
Clear Graphs
.
5 To generate a PDF report containing Web Application Firewall statistics, click
Download Report
.
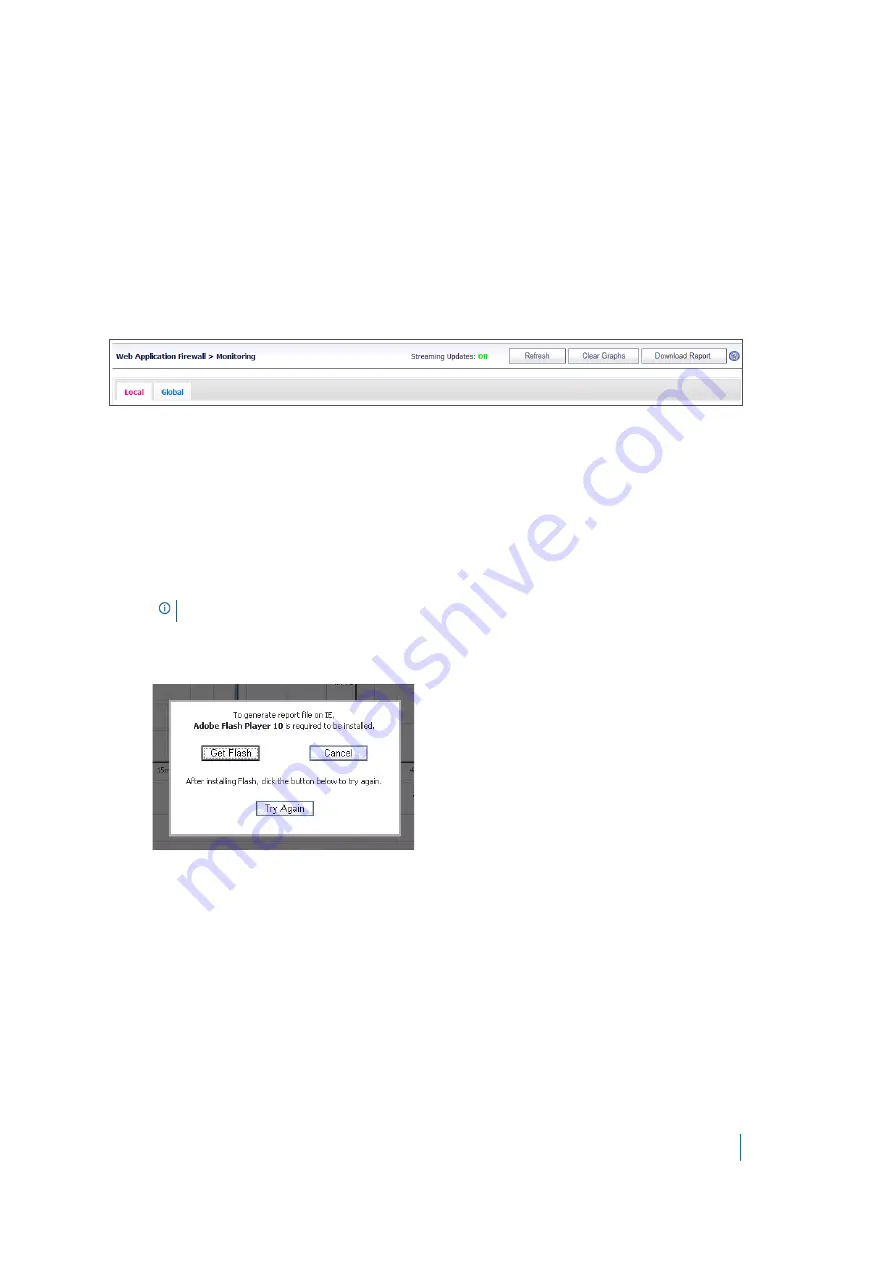
6 If prompted to install Adobe Flash Player, click
Get Flash
and then after the installation click
Try Again
to generate the PDF report from Internet Explorer.
Monitoring Web Server Status
On the
Local
tab, below the control buttons, this page displays graphs for Web server status. One graph shows
the number of Web requests detected over time, and another graph shows the amount of traffic in kilobytes
(KB).
The Web servers tracked are those servers within the local network of the SMA/SRA appliance that provide
HTTP/HTTPS bookmarks, offloaded applications, and other Web services. The Traffic graph indicates the
amount of HTTP/HTTPS payload data that is sent to client browsers.
You can view Web server activity on the
Local
tab over different time periods by selecting one of the following
options from the
Monitoring Period
drop-down list:
•
Last 60 Seconds
•
Last 60 Minutes
NOTE:
Internet Explorer requires Adobe Flash Player version 10 or higher to generate the report.


