


DGS-3048 Gigabit Ethernet Switch Manual
11
Monitoring
The fourth Web Manager main folder is Monitoring and includes the following windows and sub-folders:
Port Utilization
,
Packets
,
Errors
,
Size
,
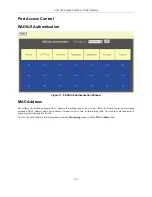
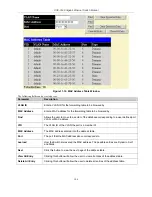
MAC Address
,
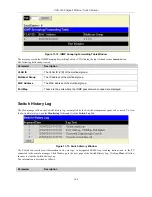
Switch History Log
,
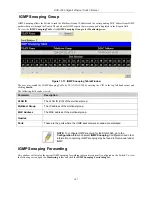
IGMP Snooping Group
,
IGMP Snooping Forwarding
,
VLAN Status
,
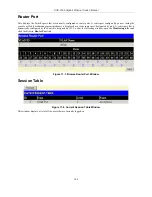
Router Port
,
Session Table
, and
Port Access Control
, as well as secondary windows.
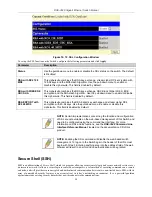
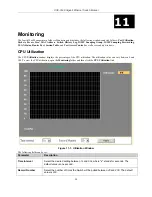
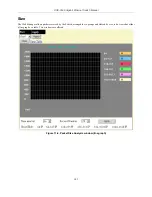
CPU Utilization
The CPU
Utilization
window displays the percentage of the CPU utilization. The utilization value can vary between 0 and
100. To view the CPU utilization, open the
Monitoring
folder and then click the
CPU Utilization
link
Figure 11-1. Utilization Window
The following fields can be set:
Parameter
Description
Time Interval
Select the desired setting between
1s
and
60s
, where "s" stands for seconds. The
default value is one second.
Record Number
Select the number of times the Switch will be polled between
20
and
200
. The default
value is
200
.
98
Содержание D DGS-3048 DGS-3048
Страница 1: ...D Link DGS 3048 Managed 48 Port Gigabit Ethernet Switch Manual ...
Страница 2: ......
Страница 29: ...DGS 3048 Gigabit Ethernet Switch Manual Figure 6 1 Enter Network Password Dialog Box 17 ...
Страница 146: ......
Страница 147: ......


