17-13
User Guide for Cisco Security MARS Local Controller
78-17020-01
Chapter 17 Network Summary
Summary Page
•
Activity: All - Top Reporting Devices
Rated by the total number of events reported by each security device.
•
Activity: All - Top Sources
The top IP addresses that appear as session sources, ranked by session count.
•
Activity: All - Top Destinations
The top IP addresses that appear as session destinations, ranked by session count.
For all of the charts on this page, you can set different time frames, the size of the chart, view the latest
report, and so on, by clicking on the buttons in the chart’s window.
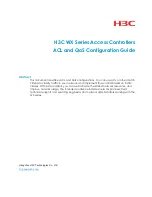
Reading Charts
These are stacked charts. You can tell which severity of incident your network has most experienced for
the day by looking for the dominant shade. In the figure below, low priority green incidents cover less
area than high priority red incidents because they have occurred less often.
Figure 17-20
A Day’s Events and Netflow with the Legend Displayed
1
Displays values by hour, day, week, month,
quarter (the last 3 months), or year.
2
Sets chart to represent the sum of all zones or
each individual zone (Global Controller only).
3
Displays a larger version of the chart.
4
Displays the chart legend.
5
The chart legend
143150
1
2
3
4
5
Содержание CS-MARS-20-K9 - Security MARS 20
Страница 20: ...Contents xx User Guide for Cisco Security MARS Local Controller 78 17020 01 ...
Страница 356: ...17 16 User Guide for Cisco Security MARS Local Controller 78 17020 01 Chapter 17 Network Summary Summary Page ...
Страница 420: ...20 28 User Guide for Cisco Security MARS Local Controller 78 17020 01 Chapter 20 Queries and Reports Reports ...
Страница 580: ...Glossary GL 4 User Guide for Cisco Security MARS Local Controller 78 17020 01 ...