

20021201
α
-9-3
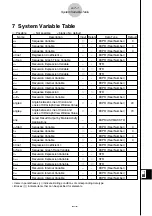
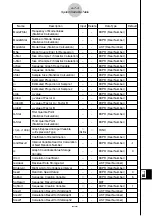
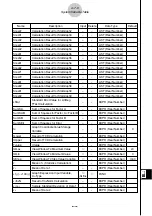
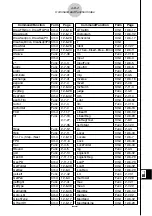
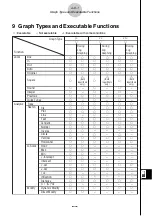
Graph Types and Executable Functions
Zoom
Graph Type
Function
Analysis
Sketch
G-Solve
Modify
Box
In
Out
Auto
Original
Square
Round
Integer
Previous
Quick Types
Trace
Cls
Plot
Line
Text
Normal
Inverse
Circle
Vertical
Horizontal
Root
Max
Min
Intersect
Inflection
Distance
π ∫
f
(
x
)
2
d
x
∫
d
x
x
-cal
y
-cal
y
-Intercept
Tangent
Dynamic Modify
Direct Modify
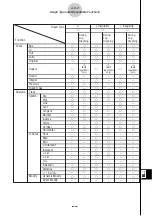
3D
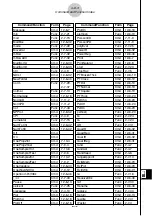
−
䊊
䊊
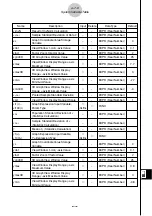
Statistical - Plot
Statistical Regression
−
䊊
䊊
−
−
−
−
−
−
−
−
䊊
䊊
−
−
䊊
−
−
−
−
−
−
−
−
−
−
−
−
−
−
−
−
−
−
−
−
−
−
−
−
−
−
−
−
−
−
−
−
−
−
−
−
−
−
−
−
−
−
−
−
−
−
−
−
−
−
䊊
䊊
䊊
−
䊊
䊊
䊊
䊊
䊊
䊊
䊊
䊊
䊊
䊊
䊊
−
−
−
䊊
䊊
䊊
−
−
−
−
−
−
−
−
−
−
−
−
−
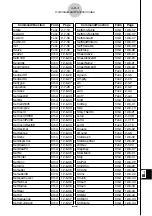
䊊
䊊
䊊
−
䊊
−
−
䊊
−
䊊
䊊
䊊
−
䊊
−
−
−
−
䊊
䊊
−
−
−
−
−
−
−
−
−
−
−
−
−
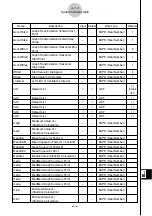
䊊
䊊
䊊
−
䊊
䊊
䊊
䊊
䊊
䊊
䊊
䊊
䊊
䊊
䊊
䊊
䊊
䊊
䊊
䊊
䊊
−
−
−
−
−
−
−
−
−
−
−
䊊
䊊
䊊
䊊
䊊
−
䊊
−
−
䊊
−
䊊
䊊
䊊
−
䊊
䊊
䊊
䊊
−
䊊
䊊
−
−
−
−
−
−
−
−
−
−
−
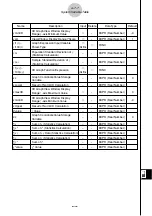
䊊
䊊
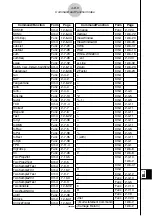
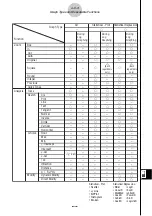
䉭
(Both
logarithms
only)
䉭
(Both
logarithms
only)
During
Log
Graphing
During
Log
Graphing
During
Log
Graphing
䉭
(
z
-cal)
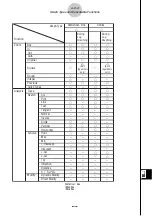
• NDist
• LinearR
• MedMed
• QuadR
• CubicR
• QuartR
Statistical - Plot
• LogR
• ExpR
• abExpR
• PowerR
• SinR
• LogisticR
Statistical Regression
• Scatter
•
xy
Line
• NPPlot
• Histogram
• Broken
20030401


