

20021201
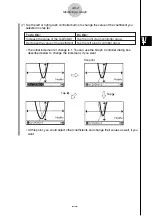
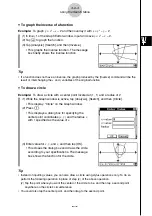
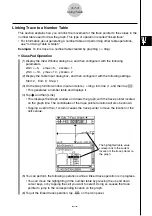
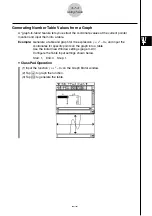
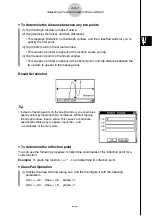
(4) Tap the Graph window to make it active. Next, tap [Analysis] and then [Trace].
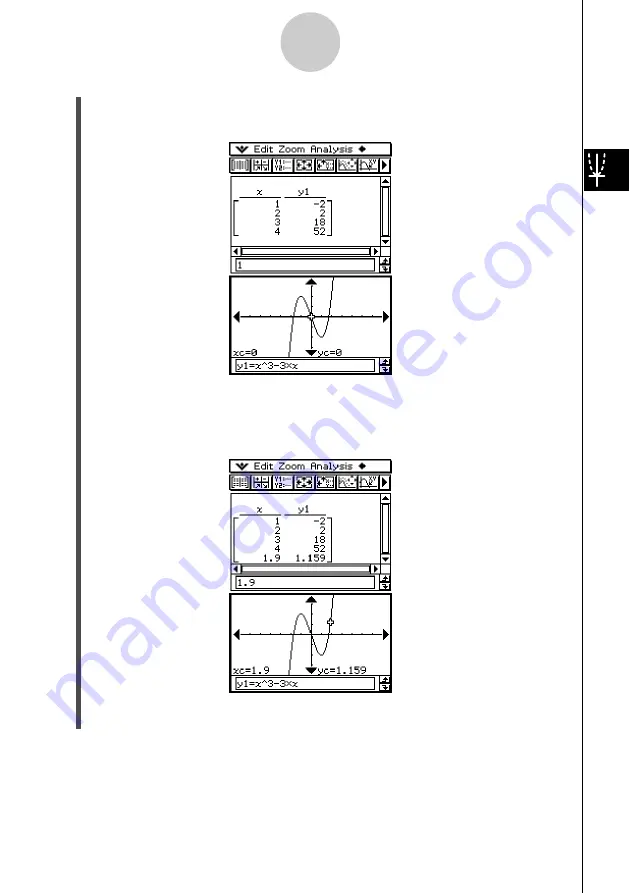
• This causes a pointer to appear on the graph.
(5) Use the cursor key to move the pointer along the graph until it reaches a point whose
coordinates you want to input into the table.
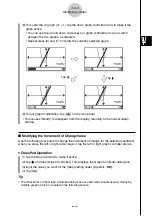
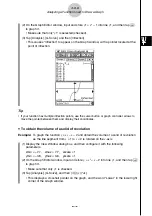
(6) Press
E
to input the coordinates at the current cursor position at the end of the table.
3-7-5
Using Trace
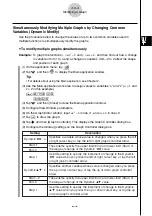
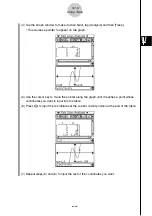
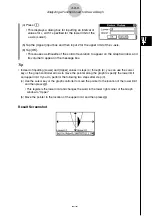
(7) Repeat steps (5) and (6) to input the rest of the coordinates you want.
20030201


