
20021201
k
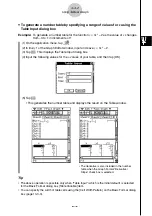
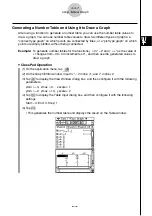
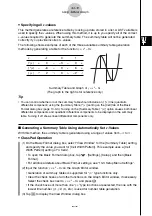
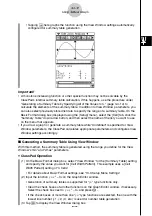
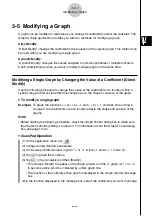
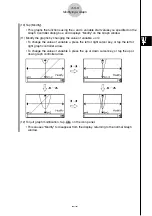
Generating a Summary Table by Specifying All of the Values for
x
In both of the previous examples, summary table generation is performed using View
Window settings to calculate values for
x
that satisfy the function
f
⬘
(
x
) = 0. With this table
generation method,
x
-values are not calculated automatically.
It is up to you to use a LIST variable to specify all of the
x
-values that appear in the summary
table.
In the example below,
x
-values will be stored in a LIST variable named “list1”, which is then
used to generate a summary table.
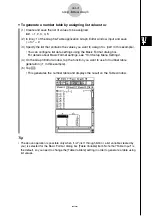
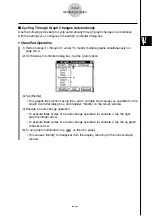
u
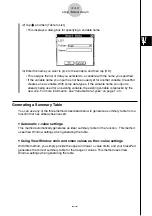
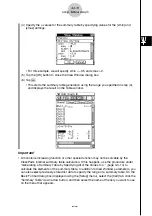
ClassPad Operation
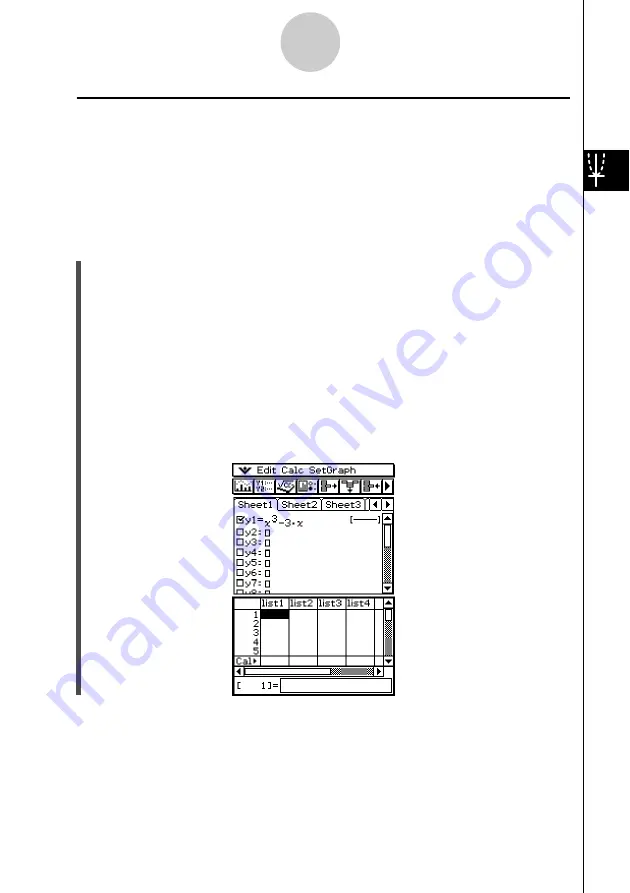
(1) On the Basic Format dialog box, select “list1” for the [Summary Table] setting, and
specify the value you want for [Cell Width Pattern]. This example uses a [Cell Width
Pattern] setting of “4 Cells”.
• For details about Basic Format settings, see “13-3 Setup Menu Settings”.
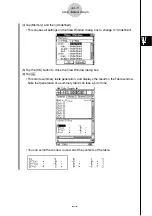
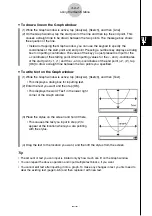
(2) Input the function
y
=
x
3
– 3
x
on the Graph Editor window.
• Generation of summary tables is supported for “
y
=” type functions only.
• Clear the check boxes of all other functions on the Graph Editor window, if necessary.
Select the check box next to
y
=
x
3
– 3
x
and press
E
.
• If the check boxes of more than one “
y
=” type functions are selected, the one with the
lowest line number (
y
1,
y
2,
y
3, etc.) is used for number table generation.
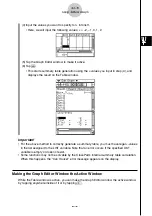
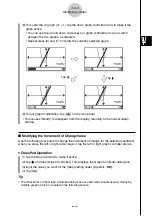
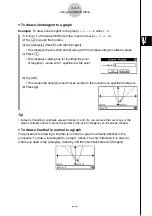
(3) Tap
O
and then [List Editor] to display the List Editor window.
3-4-14
Using Table & Graph


