


20021201
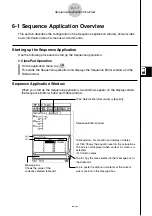
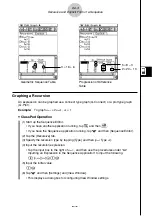
(7) Configure View Window settings as shown below.
xmin = 0
xmax = 6
xscale = 1
xdot: (Specify auto setting.)
ymin = –15
ymax = 65
yscale = 5
ydot: (Specify auto setting.)
(8) After everything is the way you want, tap [OK].
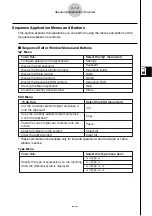
(9) Tap the down arrow button next to
#
, and then select
+
to create the table.
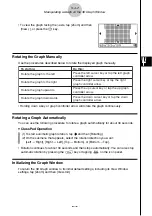
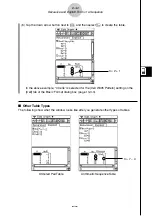
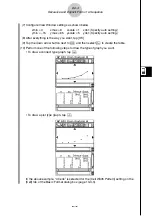
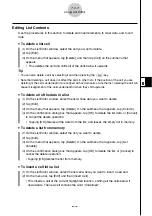
(10) Perform one of the following steps to draw the type of graph you want.
• To draw a connect type graph, tap
$
.
6-3-4
Recursive and Explicit Form of a Sequence
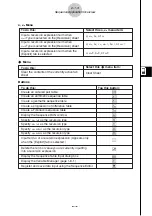
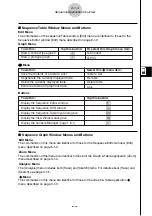
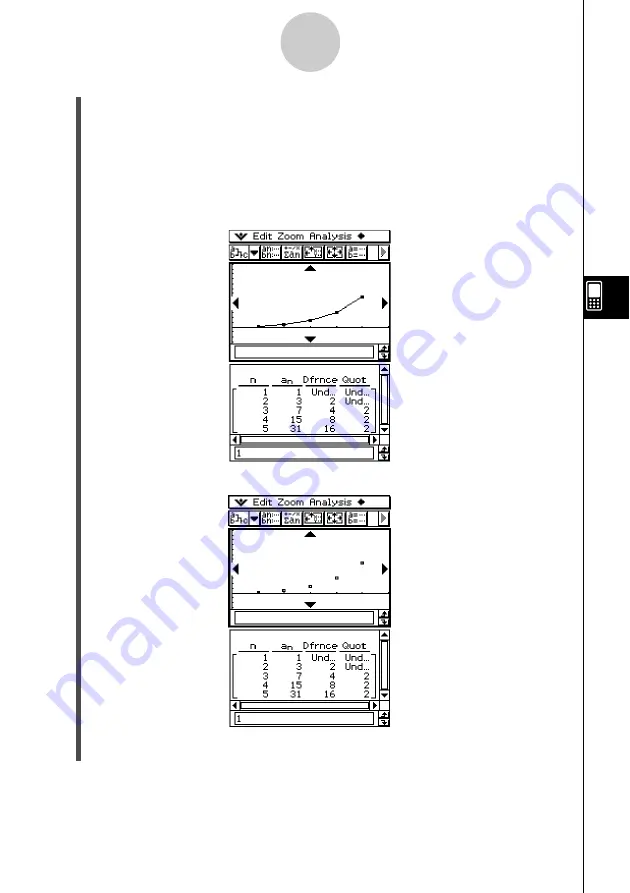
• To draw a plot type graph, tap
!
.
In the above example, “4 Cells” is selected for the [Cell Width Pattern] setting on the
[Cell] tab of the Basic Format dialog box (page 13-3-3).


