pCOWeb
+030220966 – rel. 1.1 – 12.12.2017
31
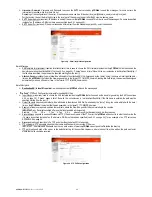
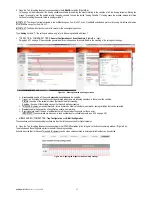
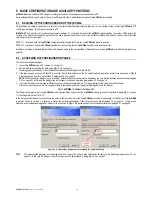
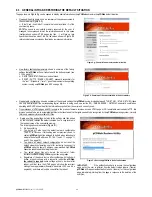
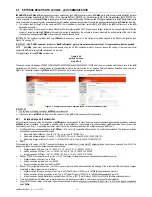
Figure 5.e - Logger and graphs: configuration
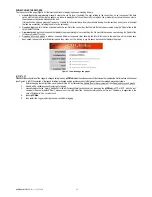
GROUPS AND SCALES
The graph is able to represent up to five different streams of data and therefore, in order optimize the scales used, it is necessary to define two or more sets
of data (temperature, pressure, power consumption...) so that they can be gathered together and therefore represented in one of the two scales (one on left-
hand side of the graph and one of the right-hand side) without losing resolution and quality or overcomplicating the graph.
Each and single variable represented in the graph has to be assigned to one of the following groups:
•
Group 1 - Left Axis
•
Group 2 – Right Axis
•
Group 3 – Digital Variables (Dig)
To correctly represent the variables in the graph it is very important to define meaningful ranges for the scales, these ranges can be obtained by:
•
Auto Adaption: the graph will automatically calculate the highest and lowest value reached by all the variables of the same group and automatically adjust
the scale
•
Manual: Limits are defined by the user, if one or more values overtake the boundaries they will be showed like if they are going out of the graph.
IMPORTANT:
pCOWeb
offers also the possibility to make graph in BMP format (the only available format before 1.4.2);
pCOWeb
creates a file in .bmp format containing a simple graph of the trend in the values of just one of the logged variable. There is a specific html page to
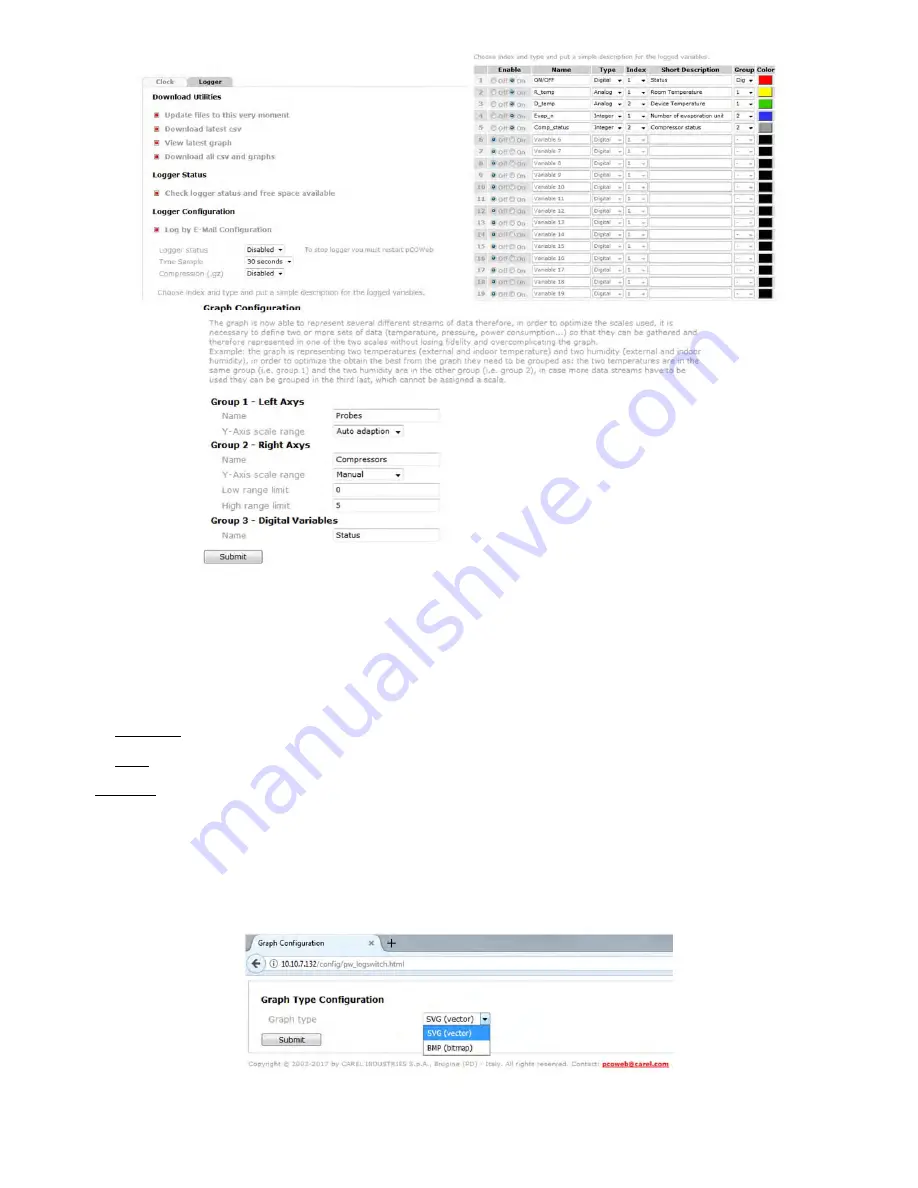
set the type of the graph called “pw_logswitch.html” typing in the browser:
http://10.10.7.132/config/pw_logswitch.html
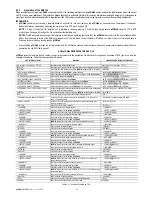
pCOWeb
will display the page as in
Figure 5.f
:
After switching
pCOWeb
to the favourite graph format, it is necessary to go back to the logger page and configure again the logged variables. After this, to let
the new settings work it is mandatory to reboot.
Please note, that BMP files occupance memory is much more than SVG files, for this reason the default graph is a SVG file format.
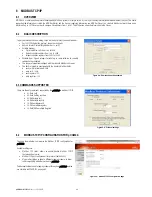
Figure 5.f - Graph Type Configuration page

