25
Single Location Analyzer
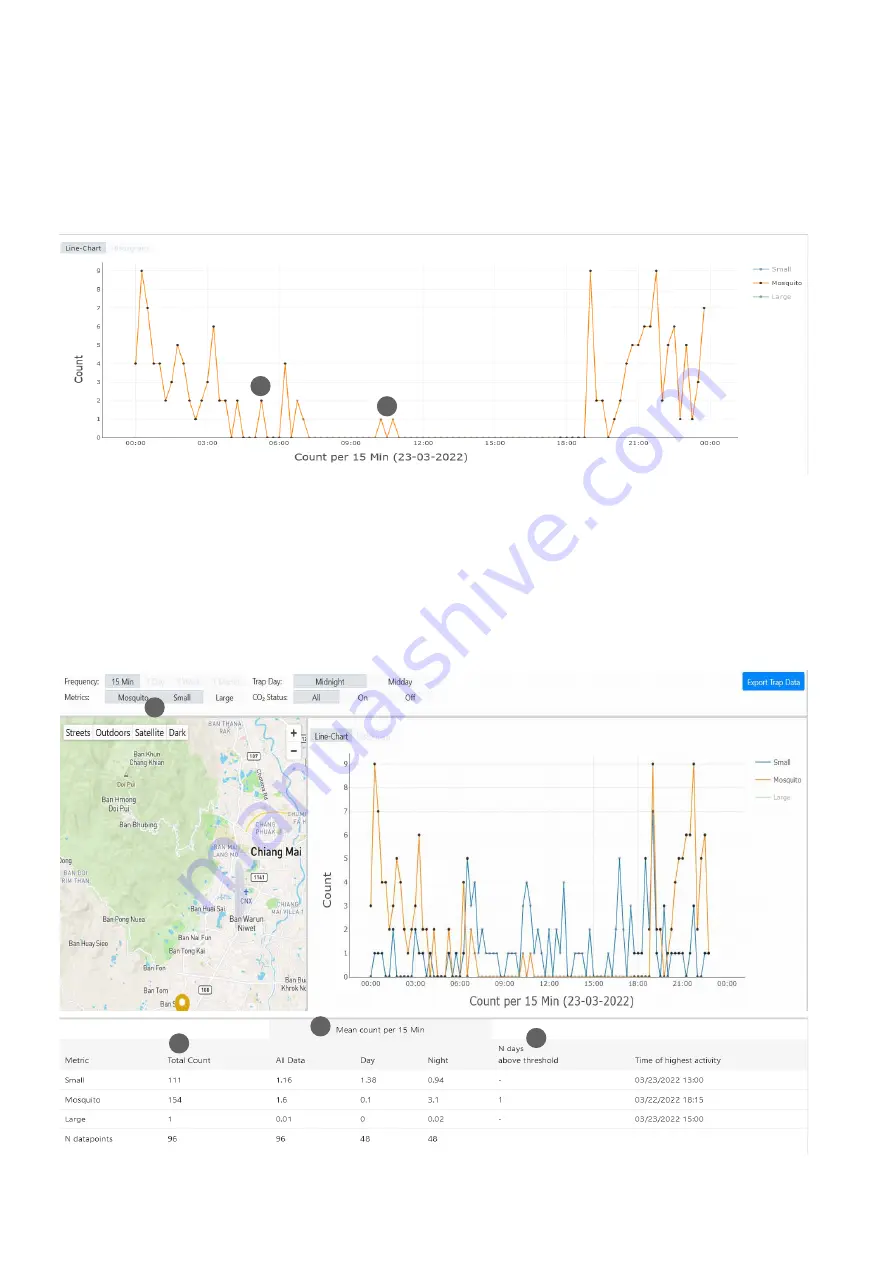
The default chart that appears once you access the Analyzer
for a single location is a line chart of the current day, with a
temporal resolution of 15 min. Hover over a data point and
info about this data point will be displayed in a pop-up win-
When analyzing a single location, you can select multiple
metrics (mosquitoes, small objects, large objects) to be dis-
played in the line chart at the same time. Select the metric/s
that you want to be displayed in the global settings (21).
When analyzing a single location, the table below the graph
always includes all three metrics. The column “Total Count”
(22) is the sum of Mosquitoes (small objects, large objects)
collected. The following three columns (23) refer to the mean
dow. Black data points (19) refer to a 15 minutes time win-
dow, at which CO
2
was set “ON” in the CO
2
schedule, and grey
points (20) refer to 15 min time windows, at which CO
2
was
“Off”, according to schedule.
count per 15 minutes (or 1 day, 1 week, 1 month - depending
on which frequency you select in the Analyzer settings) – for
all data, and day-and nighttime separately. “N days above
threshold” (24) indicates if / and on how many days the lo-
cation was above the threshold (you can specify a mosquito
catch index threshold in the settings). As it is not possible
to define a threshold for small and large objects, the value
in that column will always be a dash (not available). The last
column indicates the day (or time) of highest activity.
21
20
22
19
23
24


