19
Graphs
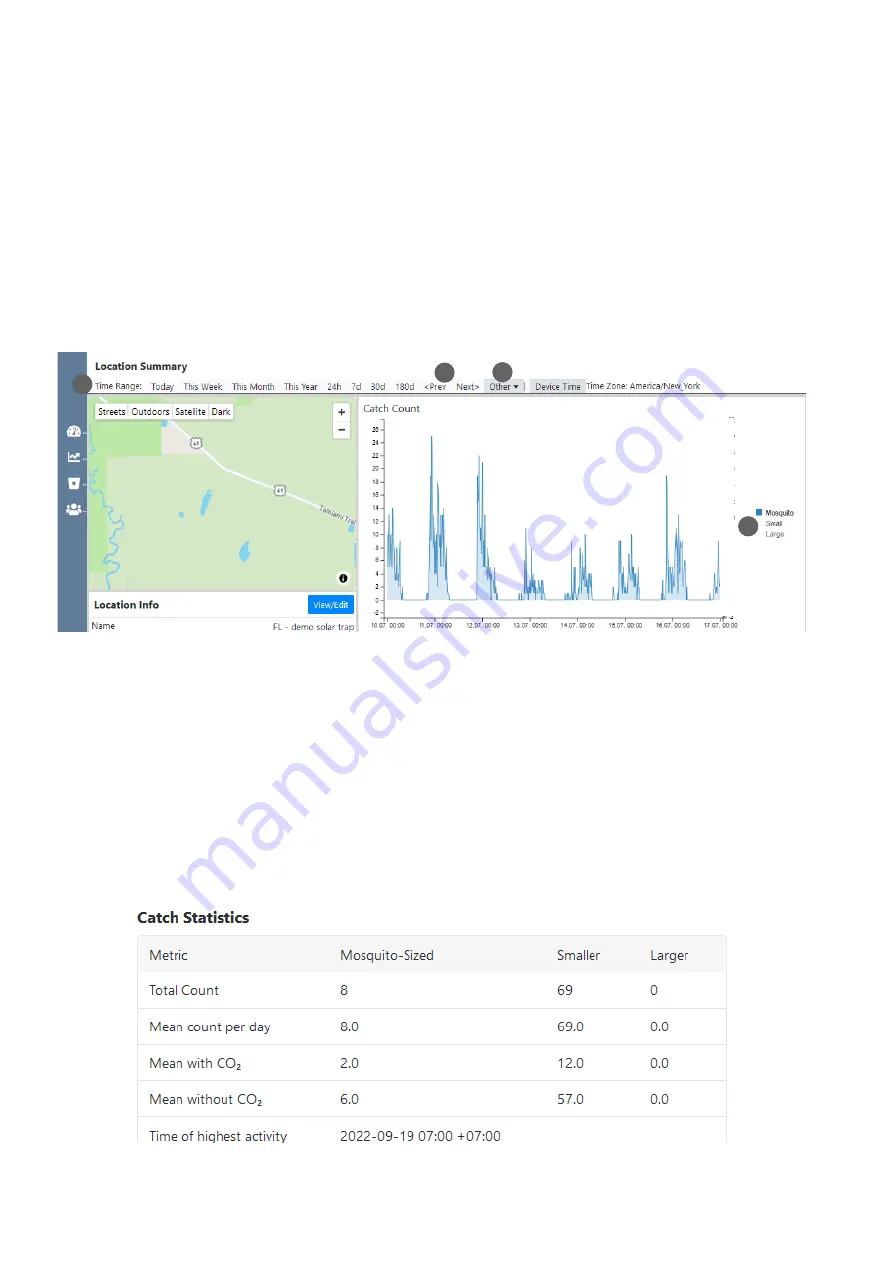
There are three line charts on the Location Summary page:
•
“Catch Count” (2)
•
“Trap Status Parameters - Temperature, Relative Humidity & Dew Point”
•
“Trap Status Parameters - Battery Voltage & Ambient Light”
•
The “
Catch Count
” graph shows mosquito counts by default,
but you can click on “Large” and/or “Small” in the graph’s le-
gend (7), to add the count data of large and/or small objects.
By clicking on a category that is currently shown in the graph,
you can remove it. The same applies for the two other graphs.
All graphs show the data on a temporal resolution of 15 mi-
nutes. In the upper left menu, you can change the
time range
(4)
of the x-axes of all three graphs. By clicking on “
other
” (5),
you can specify a customized time range. When you select
one of the time range options “
Today
”, “
This Week
”, “
This
Month
”, or “
This Year
”, you can use the
<Prev
and the
Next>
buttons (6) to navigate from one day, week, month, or year to
the previous or next day, week, month, or year.
Catch Statistics table
The Catch Statistics table shows you the statistics of the chosen Time Range: Total Count of mosquitoes, small and large
objects, the mean count per day (if time range > 1 day), mean count with and without CO
2
, and the time of highest mosquito
activity.
For example, you can display only the temperature, humidity,
or dew point, instead of all three at the same time. Use the
scrolling wheel of your mouse to zoom in and out at specific
positions in the graphs.
7
4
6
5


